Important Note!
We use cookies to ensure you get the best experience on our website.
By clicking ‘Agree,’ you accept our use of cookies as outlined in our cookies policy

The US Dollar Index (USDX) is showing signs of completing its ABC corrective structure, with price likely finishing Wave (c) near a key Fibonacci support zone.
The current rebound suggests that buyers are stepping back into the market after the support area successfully held the recent decline.
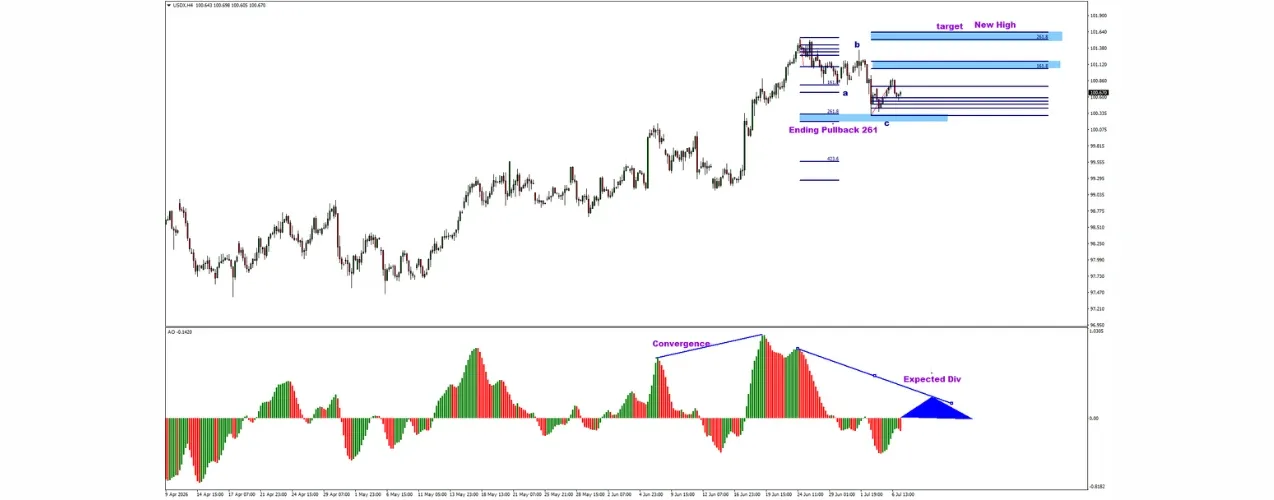
The highlighted pink area represents a major support zone, where buying pressure has started to outweigh selling pressure.
As long as USDX remains above this support, the bullish outlook remains intact. The current price action also suggests the potential development of a new impulsive wave that could extend the broader uptrend.
If bullish momentum continues to build, the first upside objective is located around the 261.8% Fibonacci Extension, followed by a retest of the previous swing high.
A successful breakout above this resistance would confirm the continuation of the bullish trend and increase the probability of USDX establishing a new higher high.
The Awesome Oscillator (AO) previously displayed convergence and is now showing the potential for a bullish divergence to develop.
If this divergence is confirmed alongside strengthening bullish momentum, it would provide additional evidence that the corrective phase has ended and a new bullish leg is underway.
USDX appears to have completed its ABC correction and is showing early signs of resuming its broader uptrend. As long as price remains above the key support zone, the bullish outlook remains favorable, with the potential to challenge previous highs and eventually establish new highs.


The XAUUSD H4 chart is showing an interesting potential bullish reversal structure after a significant decline from the 4,650–4,690 region toward the 4,080–4,085 area....

The AUDUSD weekly chart continues to show an interesting bullish Elliott Wave structure following the strong recovery from the previous major low.

Get the FXGT App


