Important Note!
We use cookies to ensure you get the best experience on our website.
By clicking ‘Agree,’ you accept our use of cookies as outlined in our cookies policy

Bitcoin continues to recover from its previous corrective decline, with price maintaining a constructive higher-low structure on the H4 timeframe. The current Elliott Wave count suggests that the market has likely completed a larger ABC correction and is beginning a new impulsive bullish sequence.
Supported by Fibonacci projections and improving market structure, Bitcoin appears well-positioned for another leg higher if key support levels continue to hold.
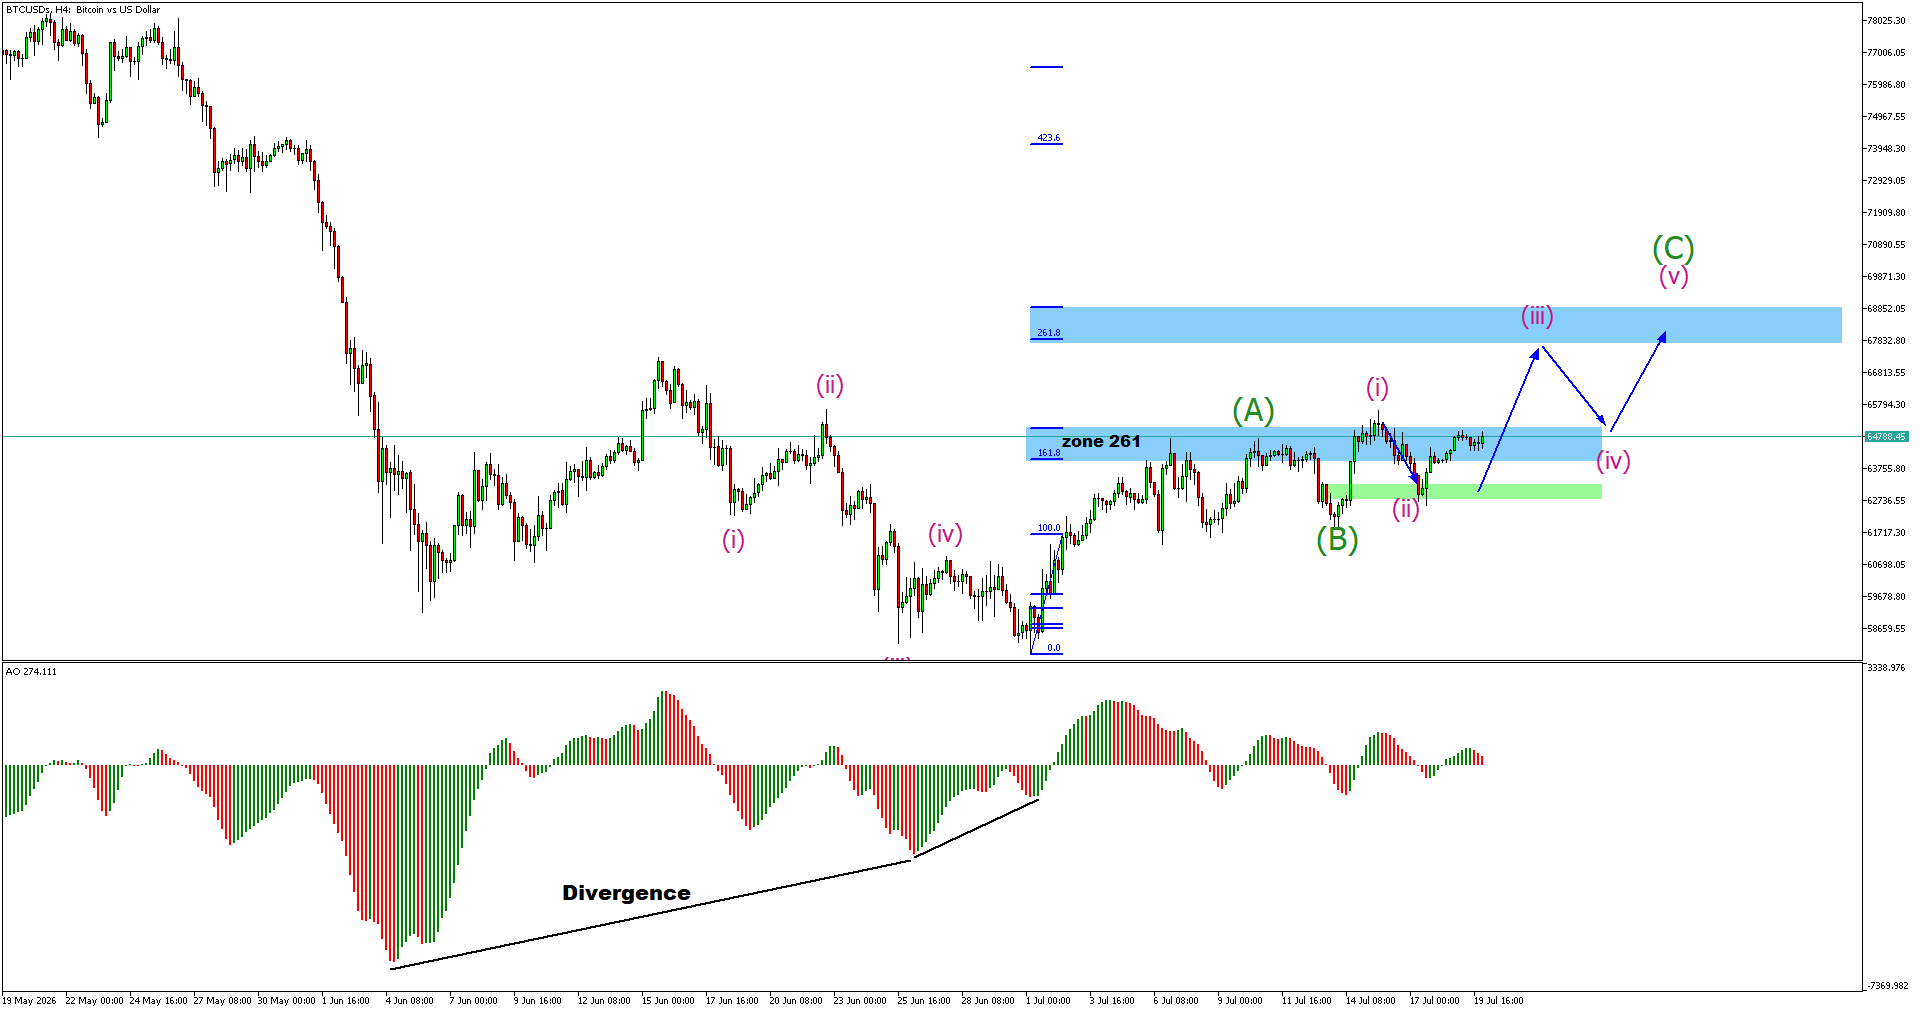
The larger corrective structure labelled (A)-(B)-(C) appears to have reached completion, with buyers successfully defending the support area around the projected Wave (B).
Following this correction, price has started to establish a series of higher highs and higher lows, indicating that bullish momentum is gradually returning.
As long as Bitcoin remains above the highlighted support zone, the bullish scenario remains valid.
The current price action suggests that Bitcoin is developing an impulsive five-wave structure.
After the completion of Wave (ii), the market is expected to begin Wave (iii), which is typically the strongest and longest wave within an Elliott Wave impulse.
The immediate upside objective lies near the Fibonacci 261.8 extension, where the first major resistance zone is located. A successful breakout above this area could pave the way for Wave (v) and the completion of the larger Wave (C).
Momentum Continues to Support Buyers
The Awesome Oscillator continues to show positive momentum following the earlier bullish divergence that marked the previous market bottom.
Although short-term momentum has moderated during the recent consolidation, it remains consistent with a healthy pause before another potential impulsive advance.
The absence of bearish divergence also supports the view that buyers still maintain control of the medium-term trend.
The highlighted Zone 261 now serves as the primary resistance area for the current bullish cycle.
If buyers manage to break and hold above this resistance, Bitcoin could accelerate toward the projected Wave (v) target and complete the larger Wave (C).
Conversely, a sustained break below the Wave (ii) support would weaken the current Elliott Wave count and increase the probability of a deeper corrective phase before the bullish trend resumes.
Bitcoin continues to display encouraging technical signals after completing its larger ABC correction. The current Elliott Wave structure favors further upside, with Wave (iii) expected to drive the next significant bullish move.
As long as key support remains intact, traders should monitor the Fibonacci 261.8 resistance closely, as a confirmed breakout could signal the beginning of another strong bullish expansion toward the projected Wave (C) objective.


What makes it possible for a trader to gain exposure to the S&P 500, gold, a major technology company, the US dollar, or Bitcoin, all from a single trading account? The a...


The cryptocurrency market remains in focus as Bitcoin stages a recovery despite significant ETF outflows, security concerns, and growing regulatory scrutiny.


Get the FXGT App


