Important Note!
We use cookies to ensure you get the best experience on our website.
By clicking ‘Agree,’ you accept our use of cookies as outlined in our cookies policy

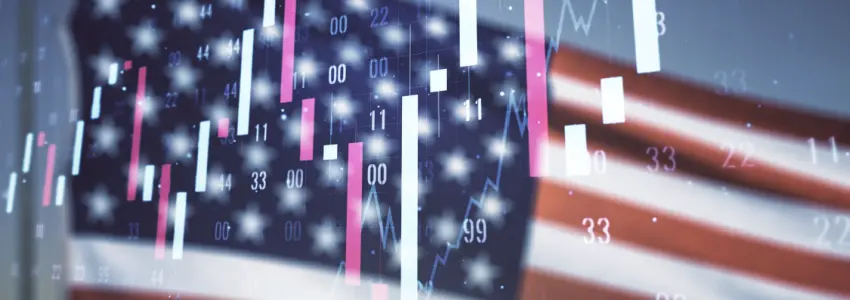
Global markets are bracing for impact as President Trump’s “Liberation Day” tariffs prepare to take effect on April 2, threatening to upend decades of international trade norms. The sweeping measures are expected to raise US tariffs to levels unseen since the 1800s, sparking fears of recession, stagflation, and a broader global slowdown. Investor sentiment has turned volatile, with equities swinging sharply and key currency pairs like USDJPY reflecting the policy uncertainty. From rising inflation pressures to geopolitical realignments, the outlook is shifting fast.
Trump’s sweeping new tariff plan, set to launch on April 2—dubbed “Liberation Day”—is poised to rewrite global trade rules and potentially trigger a major economic disruption. The reciprocal tariffs could surpass even the infamous 1930 Smoot-Hawley duties in scope, raising US tariffs to levels not seen since the 1800s. Markets are rattled, global leaders are bracing for retaliation, and economists warn of recession, inflation, and lasting damage to the post-WWII trade system. While Trump touts investment and fairness, businesses fear uncertainty, rising costs, and a consumer backlash, with global growth forecasts already being slashed.
US stocks dropped sharply Friday as Donald Trump’s new tariff policy rattled investors and raised fears of stagflation. The S&P 500 fell 2%, and the Nasdaq slid 2.7%, while Treasury yields declined as demand for safer assets rose. Trump announced new 25% tariffs on imported cars and parts, starting in April and May, claiming they would boost jobs and growth. However, analysts argue similar tariffs in 2018 had little impact, and new ones could cost American households an extra $2,000 annually. Canada responded with plans for retaliatory tariffs, escalating trade tensions.
US stocks staged a dramatic rebound on Monday to close higher, with the S&P 500 reversing a 1.7% drop to finish up 0.6%—its biggest intraday turnaround in weeks. End-of-quarter portfolio rebalancing, dividend stock buying, and technical factors helped offset investor anxiety over President Trump’s upcoming tariff announcement. Despite the recovery, the S&P 500 and Nasdaq 100 posted their worst quarters since 2022, with the S&P trailing global peers by the widest margin since 2009. Value stocks outperformed growth by the most in over two decades. Wall Street remains on edge, with recession risks rising and forecasts for US equities being trimmed amid ongoing trade policy uncertainty.
US consumer spending remained weak in February, while core inflation ticked up to 2.8%, adding pressure ahead of Donald Trump’s April 2 tariff rollout. The new 25% tariffs on autos and parts have raised fears of stagflation and trade retaliation. Canada’s economy has already stalled, and more global economic fallout is expected. Meanwhile, other countries like Germany, the UK, and India are adjusting policies in response to both domestic and U.S.-related pressures, with inflation trends, rate changes, and geopolitical tensions shaping a fragile global economic outlook.
The USDJPY pair has rebounded from its March 11 low of 146.530, gaining 1.45% and notching a four-week streak of higher closes. This recovery reflects growing bullish sentiment, supported by improving technical signals and heightened expectations around President Donald Trump’s upcoming tariffs.
At the time of writing, the pair has moved above the 20-period Exponential Moving Average (EMA), indicating a rise in short-term buying pressure. However, price action remains capped below the 50-period EMA, suggesting that while near-term momentum is improving, the broader trend warrants a measured approach. The EMAs have yet to form a bullish crossover, keeping the overall bias cautiously optimistic.
Momentum indicators offer further confirmation of strengthening bullish undercurrents. The Momentum oscillator remains firmly above the 100 mark, while the Relative Strength Index (RSI) holds above the 50 threshold—both indicative of continued demand.
Should upward momentum falter, key support levels to monitor include 148.693, followed by the March low at 146.530, and then 144.111. Conversely, a sustained breakout higher could put resistance levels at 151.295, 152.715, and 154.166 in focus.
Overall, the technical landscape suggests a gradual shift toward bullish control, though confirmation from a break above the 50 EMA or a bullish EMA crossover is needed to validate a more robust upside continuation.
As President Trump’s “Liberation Day” tariffs approach, markets remain caught between uncertainty and volatility. With potential repercussions echoing the protectionism of the 1930s, the stakes are high—not just for the US but for the global economy. Investors are grappling with shifting inflation dynamics, geopolitical tensions, and a fragile growth outlook. While technical indicators hint at pockets of optimism—particularly in currency markets like USDJPY—the broader sentiment remains cautious. The coming days will be pivotal in determining whether this bold trade agenda leads to revitalization or widespread economic strain.
USDX remains bullish as long as it holds above the key support zone


Overview Global markets had a busy week, driven by key economic data, central bank updates, energy market developments, and major corporate earnings. Inflation, GDP, jobl...


