Important Note!
We use cookies to ensure you get the best experience on our website.
By clicking ‘Agree,’ you accept our use of cookies as outlined in our cookies policy

AUD/USD is currently developing a corrective recovery following the completion of Wave A. The latest price action suggests that the market is forming Wave B as part of a larger corrective structure.
Based on the Elliott Wave count, Wave B is approaching an important Fibonacci resistance area, where the current pullback could potentially reach completion before AUD/USD resumes its broader bearish structure through Wave C.
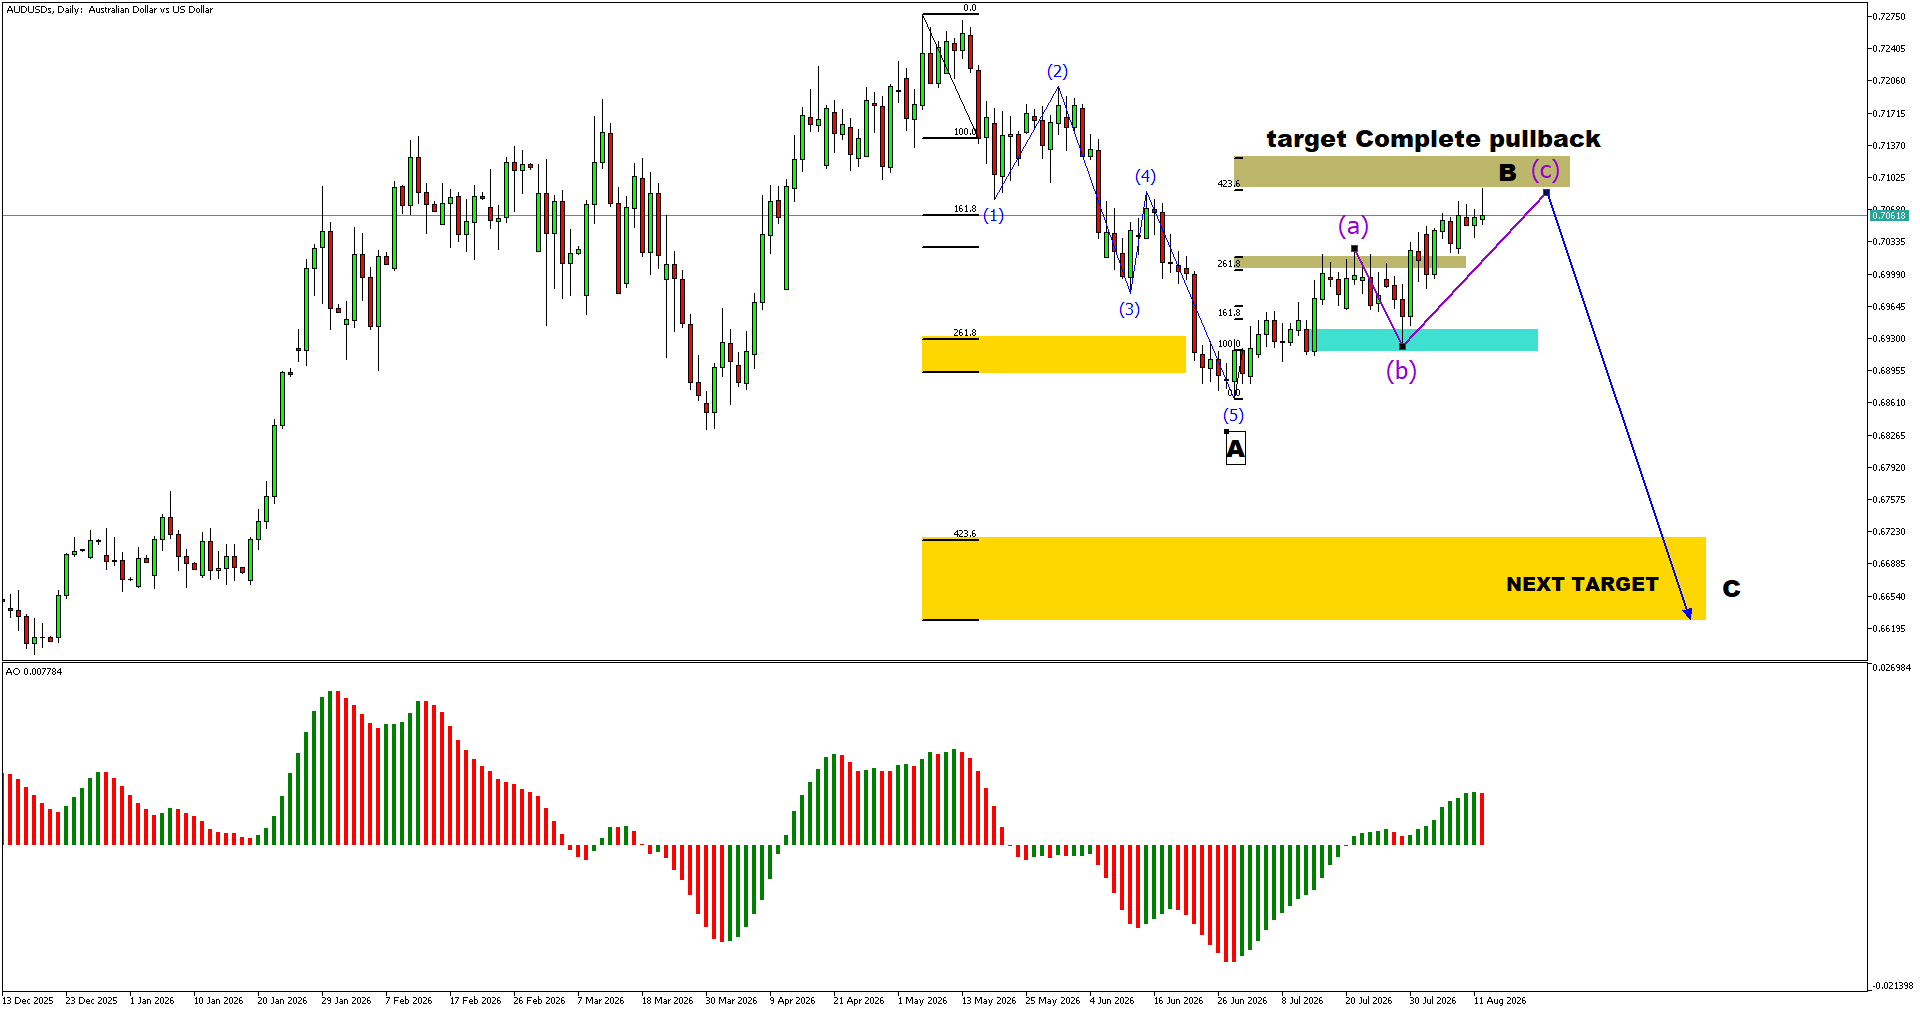
Following the completion of Wave A near the lower support area, AUD/USD has staged a recovery that appears to be developing as an ABC corrective structure.
Subwave (a) and Subwave (b) have already developed, while the current price movement is advancing toward the projected completion zone of Wave B.
The highlighted upper zone around the 423.6% Fibonacci extension represents an important resistance area. If price reaches this zone and begins to show signs of rejection, it could provide confirmation that Wave B is approaching completion.
As long as the broader Elliott Wave structure remains intact, the current recovery should continue to be treated as a corrective pullback rather than a confirmed bullish trend reversal.
Once Wave B is completed, the preferred scenario is for AUD/USD to begin Wave C to the downside.
The projected Wave C target is located within the highlighted lower Fibonacci zone around 0.6620–0.6720.
This area represents a significant potential support zone and could become the next major destination if bearish momentum returns.
The projected movement would therefore follow the structure:
Wave A completed → Wave B corrective recovery → Wave C decline.
Fibonacci projections provide additional confirmation to the current Elliott Wave structure.
The upper Fibonacci extension zone is positioned near the projected completion area of Wave B, while the lower 423.6% Fibonacci zone provides the projected target for Wave C.
This creates a clear technical framework in which traders can monitor the completion of Wave B before looking for opportunities to participate in the next bearish leg.
The Awesome Oscillator (AO) has recently moved into positive territory, reflecting the improvement in bullish momentum during the Wave B recovery.
However, the increase in momentum should not automatically be interpreted as confirmation of a new bullish trend.
If the AO begins to weaken as price reaches the Wave B resistance zone, particularly together with a bearish reversal pattern, it would strengthen the possibility that the corrective recovery is nearing completion.
The preferred scenario remains for AUD/USD to complete Wave B near the highlighted resistance zone before beginning Wave C.
Traders should monitor the following confirmations:
A confirmed bearish reversal from the Wave B target would strengthen the probability of a move toward the projected Wave C target zone.
Conversely, a sustained breakout above the Wave B resistance area would weaken the current Elliott Wave count and indicate that a larger bullish structure may be developing.
AUD/USD remains in a corrective recovery, with the current structure suggesting that Wave B may be approaching completion.
The preferred scenario is for price to reach the highlighted Fibonacci resistance zone before reversing lower into Wave C.
The projected Wave C target is located around 0.6620–0.6720, making this area an important long-term support zone to monitor.
For now, the key focus is not on chasing the current recovery, but on waiting for Wave B completion and bearish confirmation before expecting the next major decline.


The XAUUSD H4 chart is showing an interesting potential bullish reversal structure after a significant decline from the 4,650–4,690 region toward the 4,080–4,085 area....

If you are deciding between CFD and forex trading, understanding the differences between the two is an important first step.


Get the FXGT App


