Important Note!
We use cookies to ensure you get the best experience on our website.
By clicking ‘Agree,’ you accept our use of cookies as outlined in our cookies policy

The XAUUSD H4 chart is showing an interesting potential bullish reversal structure after a significant decline from the 4,650–4,690 region toward the 4,080–4,085 area.
Although the short-term market structure remains influenced by the previous bearish move, several technical signals are beginning to suggest that bearish momentum may be weakening.
The most important signal visible on the chart is a bullish divergence on the Awesome Oscillator (AO). Price has formed a new lower low, while the AO has failed to produce a corresponding lower momentum low. This indicates that the downside momentum is weakening despite the continued pressure on price.
At the same time, price has started to stabilize around the 4,080–4,085 region and is attempting to recover.
Based on the projected price path shown on the chart, XAUUSD could potentially be developing the early stages of a new bullish structure that may become a Major Wave 1, with a primary target around 4,370–4,400.
However, the projected bullish move is unlikely to be a straight-line advance. Several important swap zones are positioned between the current price and the major target, meaning that temporary pullbacks and resistance reactions could occur along the way.
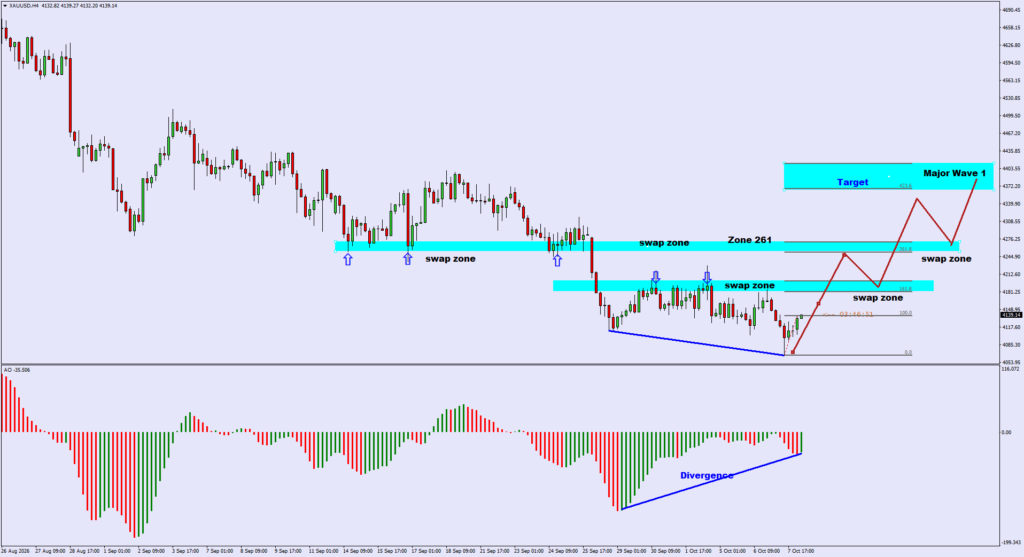
The current XAUUSD H4 structure shows that price has fallen substantially from the previous high and eventually reached a low around 4,080–4,085.
From this area, price has started to stabilize.
The technical roadmap shown on the chart can broadly be interpreted as:
Major low → bullish divergence → initial recovery → 4,180–4,200 resistance → 4,240–4,250 resistance → 4,270–4,290 resistance → 4,370–4,400 target
The 4,080–4,085 region is therefore the most important structural area at the current stage.
If this low continues to hold, it can become the foundation for a larger bullish recovery.
However, if price breaks decisively below this area, the bullish projection would need to be reassessed.
The chart suggests that XAUUSD may be attempting to establish a new bullish impulsive structure from the 4,080–4,085 low.
The red projected path shows several potential stages before reaching the Major Wave 1 target.
The potential Major Wave 1 begins from approximately 4,080–4,085.
This area represents the most recent significant low following the strong bearish decline.
If price continues to produce higher lows and higher highs from this region, it would strengthen the interpretation that a new bullish impulse is developing.
The first objective is therefore not immediately 4,370–4,400.
The market must first overcome several intermediate resistance zones.
The first projected bullish leg extends from the 4,080–4,085 low toward approximately 4,240–4,250.
This region is important because it corresponds with one of the swap zones marked on the chart.
As a result, sellers may attempt to defend this area when price reaches it.
A rejection from this zone would not necessarily invalidate the bullish structure.
Instead, it could create the first corrective pullback within the new bullish sequence.
After the initial advance, the chart projects a potential pullback toward approximately 4,180–4,200.
This area is marked as a swap zone and is also close to the 161.8% Fibonacci level.
If the previous resistance area becomes support during the pullback, the market could form an important higher low.
This would be a constructive development for the bullish Elliott Wave interpretation.
A structure such as:
Breakout → Retest → Higher Low → Continuation
would provide stronger evidence that the market is transitioning from a bearish phase into a bullish impulse.
Following a successful pullback, price could potentially resume its advance toward 4,270–4,290.
This is one of the most important resistance zones on the chart.
The area combines a marked swap zone with the 261.8% Fibonacci extension, making it a significant technical barrier.
A decisive breakout above this area would strengthen the bullish case considerably.
The projected path also shows another possible pullback after price reaches the 4,270–4,290 region.
This pullback should not automatically be interpreted as a bearish reversal.
If the zone becomes support after the breakout, the retracement could instead represent a normal corrective phase before the next bullish expansion.
After the projected pullback, the chart shows a final bullish extension toward approximately 4,370–4,400.
This region is highlighted as the Major Wave 1 Target and is positioned near the 423.6% Fibonacci extension.
Therefore, the complete projected path can be summarized as:
4,080–4,085 → 4,240–4,250 → pullback toward 4,180–4,200 → 4,270–4,290 → pullback → 4,370–4,400
Fibonacci levels are an important component of the projected structure.
Several extension levels shown on the chart coincide with the major swap zones.
The 100% Fibonacci level is positioned around 4,145–4,150.
Price is currently trading close to this region.
This makes the area important for determining whether the current rebound can develop into a stronger bullish move.
A sustained move above this level would provide room for price to continue toward the higher Fibonacci extensions.
The 161.8% Fibonacci level is positioned around the 4,180–4,200 region.
This area also coincides with a marked swap zone.
Therefore, 4,180–4,200 should be treated as the first major resistance area that buyers need to overcome.
If price breaks above this zone and subsequently holds it as support, the bullish structure would become stronger.
The 261.8% Fibonacci extension is positioned around 4,270–4,290.
This is a much more important resistance area because the Fibonacci level and swap zone overlap.
A decisive breakout above this region would significantly improve the probability of the next bullish extension.
The highest major Fibonacci projection visible on the chart is the 423.6% extension, positioned around 4,370–4,400.
This region is also marked as the Major Wave 1 Target.
Therefore, it represents the primary upside objective of the current projected structure.
The multiple swap zones shown on the chart are particularly important because they identify areas where previous market structure may influence future price behavior.
This is the first major resistance zone above the current price.
A breakout above this region would provide an early indication that buying pressure is increasing.
If price later returns to this zone and holds it as support, the former resistance could become a new demand area.
This is an intermediate resistance area within the projected bullish path.
Price may experience a temporary reaction here before continuing higher.
A successful breakout would strengthen the path toward 4,270–4,290.
This is the most important resistance zone before the major target.
The combination of the swap zone and Fibonacci 261.8% makes this an important technical decision point.
A strong breakout above this region could open the way toward the 4,370–4,400 target.
The most significant momentum signal on the chart is the bullish divergence visible on the Awesome Oscillator.
Price has moved to a lower low around 4,080–4,085.
However, the AO has not produced a corresponding lower momentum low.
Instead, the blue divergence line on the indicator connects the previous momentum low with the latest momentum low, showing that bearish momentum has weakened.
This is important because it suggests that sellers are losing momentum even though price has continued to decline.
Bullish divergence can often appear near the later stages of a bearish move and may provide an early warning that a reversal or corrective recovery is developing.
However, divergence alone does not confirm a bullish reversal.
It should be supported by additional evidence such as:
Therefore, the current divergence should be viewed as an early bullish warning signal rather than complete confirmation.
Although the bullish divergence is encouraging, the Awesome Oscillator remains below the zero line.
This indicates that the broader momentum environment has not yet completely shifted into bullish territory.
The current structure can therefore be described as:
Potential early bullish reversal
rather than a fully confirmed bullish trend.
If the AO begins moving progressively closer to the zero line and eventually crosses into positive territory, this would provide additional confirmation that bullish momentum is strengthening.
Conversely, if the AO begins expanding negatively again while price breaks below 4,080–4,085, the bullish divergence could fail.
Gold remains highly sensitive to movements in the US dollar, Treasury yields and expectations for Federal Reserve monetary policy.
Recent market conditions have created significant volatility for XAUUSD. Reuters reported that gold touched a two-month low after a stronger US dollar and higher Treasury yields pressured the metal. Gold subsequently edged higher on October 8 as the market awaited further clarity on the Federal Reserve’s interest-rate outlook.
The US dollar also remains relatively strong, with the dollar index near an 18-month high following the latest Federal Reserve minutes. The minutes reinforced concerns about inflation and indicated that policymakers remained divided over the appropriate path for interest rates.
This creates an important fundamental backdrop for the technical setup.
If the US dollar and Treasury yields remain elevated, gold may continue to face resistance during rallies.
On the other hand, any meaningful weakening in the dollar or decline in Treasury yields could provide additional support for the bullish XAUUSD scenario.
Therefore, the technical structure should be monitored together with:
US Dollar → Treasury Yields → Federal Reserve Expectations → Gold Momentum
This is the primary scenario suggested by the current chart structure.
If the 4,080–4,085 support zone continues to hold, XAUUSD could develop a new bullish sequence.
The projected path would be:
4,140–4,150 → 4,180–4,200 → 4,240–4,250 → 4,270–4,290 → 4,370–4,400
Each successful breakout would increase the probability of the next bullish leg.
XAUUSD may initially recover toward 4,180–4,200 and then experience a pullback.
This would not necessarily invalidate the bullish setup.
If the pullback creates a higher low and price subsequently breaks above the previous resistance, the structure could become even stronger.
The ideal sequence would be:
Recovery → Resistance → Pullback → Higher Low → Breakout → Continuation
This type of price action would provide stronger confirmation than a direct vertical rally.
A decisive breakout above 4,270–4,290 would represent a major technical confirmation.
This zone is important because it combines a swap zone with the 261.8% Fibonacci extension.
If price breaks above this region with strong bullish momentum and successfully holds it as support, the probability of a move toward 4,370–4,400 would increase substantially.
The bullish scenario would become significantly weaker if XAUUSD breaks below 4,080–4,085.
This level represents the key low from which the projected bullish structure begins.
A decisive breakdown below this region would indicate that the current bullish divergence has failed to produce the expected reversal.
The market could then continue the bearish structure or develop a deeper correction.
The most important invalidation area is 4,080–4,085.
As long as this region holds, the potential bullish Major Wave 1 structure remains technically possible.
However, a decisive break below this area would require the bullish Elliott Wave count to be reassessed.
Therefore:
4,080–4,085 = Major Support / Bullish Invalidation Zone
While:
4,180–4,200 = First Major Resistance
4,240–4,250 = Intermediate Resistance
4,270–4,290 = Major Resistance
4,370–4,400 = Major Wave 1 Target
| Price Level | Technical Significance |
| 4,370–4,400 | Major Wave 1 target / Fibonacci 423.6% |
| 4,270–4,290 | Major resistance / Fibonacci 261.8% |
| 4,240–4,250 | Intermediate resistance / swap zone |
| 4,180–4,200 | First major resistance / Fibonacci 161.8% |
| 4,140–4,150 | Fibonacci 100% / immediate decision area |
| 4,080–4,085 | Major low / support / bullish invalidation |
The XAUUSD H4 chart is showing an interesting potential bullish reversal structure following the sharp decline from the 4,650–4,690 region toward 4,080–4,085.
Although the broader short-term structure remains influenced by the previous bearish trend, bearish momentum appears to be weakening.
The strongest technical signal is the bullish divergence on the Awesome Oscillator, where price has created a lower low while momentum has failed to make a corresponding lower low.
This suggests that selling pressure may be losing strength.
The 4,080–4,085 area is therefore extremely important.
If this support continues to hold, XAUUSD could potentially develop a new bullish structure toward the 4,370–4,400 Major Wave 1 target.
The projected path is:
4,080–4,085 → 4,180–4,200 → 4,240–4,250 → 4,270–4,290 → 4,370–4,400
The first important confirmation would come from a sustained break above 4,180–4,200.
A stronger confirmation would occur if price breaks above 4,270–4,290, because this area represents both a major swap zone and the 261.8% Fibonacci extension.
If that resistance is successfully broken and converted into support, the path toward 4,370–4,400 becomes technically more attractive.
However, the bullish projection remains conditional.
As long as 4,080–4,085 holds, the potential bullish Major Wave 1 structure remains valid. A decisive break below this area would invalidate or significantly weaken the current bullish scenario.
The combination of bullish divergence, stabilization at the major low, Fibonacci projections, swap zones and the projected Elliott Wave structure provides a constructive setup, but confirmation through price action and momentum remains essential before treating the 4,370–4,400 target as fully confirmed.


The AUDUSD weekly chart continues to show an interesting bullish Elliott Wave structure following the strong recovery from the previous major low.

The USDX Weekly chart is showing an increasingly interesting bullish structure after the Dollar Index formed a potential major Wave C low around the 95.00–96.00 area.

Get the FXGT App


