Important Note!
We use cookies to ensure you get the best experience on our website.
By clicking ‘Agree,’ you accept our use of cookies as outlined in our cookies policy

The AUDUSD weekly chart continues to show an interesting bullish Elliott Wave structure following the strong recovery from the previous major low. The chart suggests that AUDUSD may have completed a significant Wave 4 corrective phase through an ABC correction, with price now approaching an important area where a new bullish Wave 5 could develop.
The major structure on the chart shows a previous impulsive advance from approximately the 0.60–0.61 region toward 0.73–0.74, forming the foundation for the current Elliott Wave count.
After reaching the Wave 3 high, AUDUSD entered a corrective Wave 4 structure. This correction appears to have developed through three phases: Wave A downward, Wave B upward, and Wave C downward.
The most important area on the current chart is the 0.68–0.69 Buy Zone, where Wave C appears to have completed or is attempting to complete the broader Wave 4 correction.
If this support area continues to hold, the next major objective could be a recovery toward the previous Wave 3 high around 0.73–0.74, followed by a potential Wave 5 extension toward the 0.79–0.82 target zone.
The latest RBA data also show that AUD/USD was around 0.6970 on 6 October 2026, while the RBA’s cash rate target stands at 4.60%. (Reserve Bank of Australia)
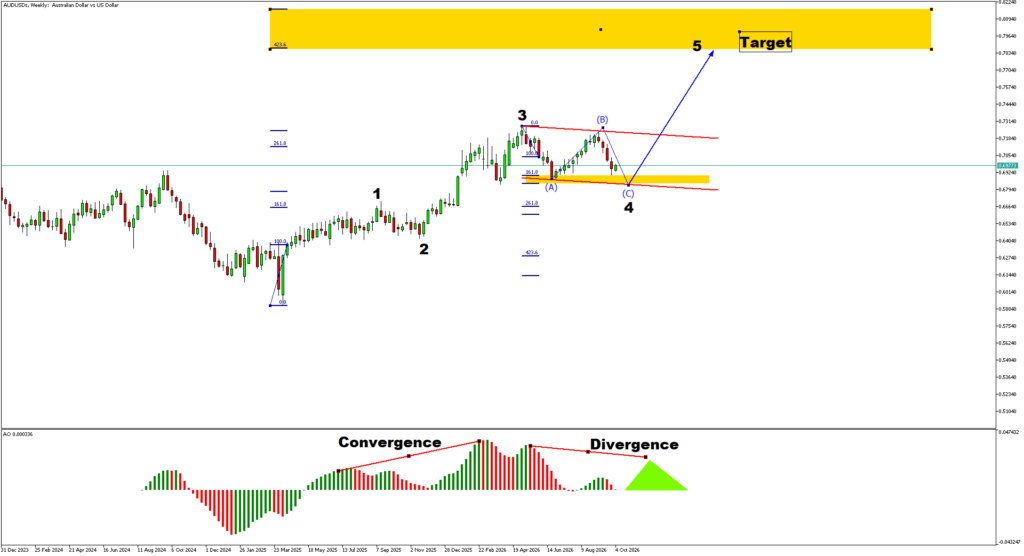
The weekly structure remains constructive as long as the major support zone around 0.68–0.69 continues to hold.
The chart shows that the market previously experienced a strong impulsive rise, suggesting that the decline from the 0.73–0.74 region may represent a correction rather than the beginning of a new long-term bearish trend.
The current price around the 0.69–0.70 area is particularly important because it sits close to the projected completion area of Wave 4.
The technical structure can therefore be interpreted as:
Wave 1 → Wave 2 → Wave 3 → Wave 4 ABC → potential Wave 5
This structure provides a bullish framework, although confirmation is still required through price action.
A sustained recovery from the current area would strengthen the possibility that Wave 4 has already completed.
The first major impulsive phase began from the lower region around 0.60–0.61.
Price then established a significant upward movement, creating the initial Wave 1 structure.
This advance was important because it established the foundation for the larger bullish cycle visible on the weekly chart.
Following the initial advance, AUDUSD experienced a corrective decline.
This pullback formed the Wave 2 structure and provided the market with a temporary retracement before the much stronger Wave 3 advance.
The fact that the market subsequently moved substantially higher supports the interpretation that the previous decline was corrective rather than the beginning of a major bearish trend.
Wave 3 produced the strongest bullish expansion in the structure, pushing AUDUSD toward approximately 0.73–0.74.
This was the key bullish expansion phase.
The Awesome Oscillator also showed stronger bullish momentum during this advance, supporting the interpretation of a developing impulsive move.
However, after the Wave 3 high was established, momentum began to weaken.
This created the conditions for the market to enter Wave 4.
The Wave 4 structure appears to have developed as a classic ABC correction.
Wave A began from the Wave 3 high around 0.73–0.74 and moved lower toward approximately 0.68–0.69.
This initial decline created the first leg of the corrective structure.
After reaching the lower area, AUDUSD staged a rebound toward approximately 0.71–0.72.
This recovery can be interpreted as Wave B.
The rebound did not successfully establish a new bullish impulse above the previous Wave 3 high, which allowed the correction to continue.
The subsequent decline from the Wave B high created Wave C.
Price moved back toward the 0.68–0.69 region, which coincides with the highlighted Buy Zone on the chart.
This is important because Wave C frequently represents the final leg of an ABC correction.
Therefore, the current structure provides a possible scenario where:
Wave A completed → Wave B completed → Wave C completed → Wave 4 potentially completed.
If this interpretation is correct, the market could now begin the next major bullish phase.
The 0.68–0.69 region is the most important support area on the current weekly chart.
This zone is significant for several reasons.
First, it corresponds with the projected completion area of Wave C.
Second, the chart specifically highlights this region as a Buy Zone.
Third, Fibonacci projections also cluster around this area, increasing its technical importance.
As long as price remains above this zone, the bullish Wave 5 scenario remains technically valid.
A successful bullish reaction from this area would strengthen the argument that Wave 4 has completed.
However, a decisive weekly breakdown below the support structure would weaken the bullish interpretation and suggest that the correction may need more time to develop.
Fibonacci projections provide additional support for the potential Wave 5 scenario.
The chart shows several important Fibonacci extension levels.
The 161.8% Fibonacci level is positioned around the lower part of the corrective structure, close to the 0.67–0.68 area.
This creates an additional reference point beneath the main 0.68–0.69 support zone.
Therefore, the 0.67–0.68 area can be considered an extended support region if the market temporarily pushes below the primary Buy Zone.
The 261.8% Fibonacci extension is another important level within the projected structure.
This level helps identify the potential extension area for the next bullish phase.
The relationship between the Wave 4 completion zone and the Fibonacci extensions supports the possibility of a larger Wave 5 advance if price successfully reverses higher.
The most ambitious projection visible on the chart is the 423.6% Fibonacci extension, located around the 0.79–0.82 target zone.
This is therefore an important long-term objective for the potential Wave 5.
The target is not necessarily expected to be reached immediately. Price may first need to break the previous Wave 3 high before the larger extension becomes technically relevant.
If Wave 4 has completed near 0.68–0.69, the next major structure could be Wave 5.
The projected bullish path can be divided into several stages.
The first requirement is for AUDUSD to maintain support around 0.68–0.69 and begin forming higher highs and higher lows.
A sustained move above the immediate resistance area would provide the first indication that the correction is losing control.
The next important resistance region is around 0.71–0.72.
This area previously acted as the Wave B recovery zone.
A decisive break above it would strengthen the bullish structure and indicate that the market is potentially transitioning from correction into a new impulsive advance.
The most important confirmation level is the previous Wave 3 high around 0.73–0.74.
A successful breakout above this area would provide much stronger confirmation of the Wave 5 scenario.
Once this resistance is broken, the market would no longer be trapped within the previous corrective structure.
Following a confirmed breakout above 0.73–0.74, the larger Wave 5 target becomes the 0.79–0.82 region.
This zone corresponds closely with the higher Fibonacci projection shown on the chart.
Therefore, the overall projected path is:
0.68–0.69 support → 0.71–0.72 recovery → 0.73–0.74 breakout → 0.79–0.82 Wave 5 target
The Awesome Oscillator provides an additional perspective on the Elliott Wave structure.
During the previous Wave 3 advance, momentum increased substantially, supporting the bullish expansion.
However, as price approached the Wave 3 high, momentum began showing signs of weakening.
The chart also highlights a divergence structure.
This is important because weakening momentum near a major Elliott Wave high can be consistent with the transition from an impulsive Wave 3 into a corrective Wave 4.
The subsequent decline toward the 0.68–0.69 region therefore fits the broader technical picture.
If the AO begins producing stronger positive bars while price holds above the Buy Zone, this would provide additional confirmation that bullish momentum is returning.
In contrast, continued negative momentum accompanied by a breakdown of 0.68–0.69 would indicate that the correction may not yet be complete.
From a fundamental perspective, AUDUSD remains sensitive to both Australian monetary policy and movements in the US dollar.
The RBA increased its cash rate target by 25 basis points to 4.60% on 29 September 2026. (Reserve Bank of Australia)
Australia’s August 2026 CPI annual change was 4.0%, according to the RBA, keeping inflation an important consideration for monetary policy. (Reserve Bank of Australia)
The RBA’s latest exchange-rate data show AUD/USD recovering to approximately 0.6970 on 6 October, after trading around 0.6933 on 2 October. (Reserve Bank of Australia)
This recent recovery is consistent with the technical possibility that AUDUSD is attempting to establish a base around the lower support region.
Nevertheless, the Australian dollar remains highly sensitive to movements in the US dollar, global risk sentiment, commodity prices and expectations surrounding future interest-rate policy.
Therefore, the fundamental environment can support the bullish technical scenario, but price confirmation remains essential.
This is the primary scenario based on the current Elliott Wave structure.
If the 0.68–0.69 Buy Zone continues to hold, AUDUSD may complete Wave 4 and begin Wave 5.
The expected sequence would be:
Wave C completion → bullish reversal → 0.71–0.72 → breakout 0.73–0.74 → Wave 5 toward 0.79–0.82.
This scenario becomes significantly stronger after a confirmed breakout above the previous Wave 3 high.
Another possibility is that AUDUSD has already started recovering but may experience another short-term pullback before attempting to break 0.73–0.74.
In this situation, price may consolidate between the current region and the 0.71–0.72 resistance zone.
Such a pullback would not necessarily invalidate the bullish structure as long as the major Wave 4 support remains intact.
This could produce a gradual accumulation structure before the next major bullish expansion.
The bearish alternative is that Wave 4 has not completely finished.
If price fails to hold the 0.68–0.69 support area, the market could extend the corrective structure toward the lower Fibonacci support around 0.67–0.68.
This would delay the Wave 5 scenario.
However, the broader bullish structure would not necessarily be invalidated immediately unless price produces a much deeper breakdown and begins violating the structural origin of the previous bullish advance.
The 0.68–0.69 area is the key structural zone that traders should monitor.
A sustained weekly breakdown below this region would weaken the current Wave 4 completion thesis.
If price moves toward 0.67–0.68, traders should monitor the reaction carefully because this region corresponds with the lower Fibonacci support area shown on the chart.
A decisive breakdown below the broader Wave 4 support structure would suggest that the current Elliott Wave count needs to be reassessed.
Therefore, the bullish scenario should not be treated as confirmed simply because price is inside the Buy Zone.
Confirmation through price action is still required.
| Level | Technical Significance |
| 0.79–0.82 | Major Wave 5 / Fibonacci target zone |
| 0.73–0.74 | Previous Wave 3 high and major breakout resistance |
| 0.71–0.72 | Intermediate resistance / previous Wave B area |
| 0.68–0.69 | Main Wave 4 / Wave C Buy Zone |
| 0.67–0.68 | Lower Fibonacci support / extended correction area |
The AUDUSD weekly chart continues to present a potentially bullish Elliott Wave structure.
The major advance from approximately 0.60–0.61 toward 0.73–0.74 appears to have been followed by a corrective Wave 4 structure.
That correction appears to have developed as an ABC pattern, with Wave C returning toward the important 0.68–0.69 support and Buy Zone.
The key question now is whether this area marks the completion of Wave 4.
If support holds and bullish momentum returns, AUDUSD could begin a new Wave 5 advance.
The first major confirmation would be a recovery above 0.71–0.72, followed by a decisive breakout above the previous Wave 3 high around 0.73–0.74.
A confirmed breakout could then open the way toward the larger 0.79–0.82 target zone, which aligns with the higher Fibonacci projection shown on the chart.
The overall technical roadmap is therefore:
Wave 4 ABC correction → Wave C support at 0.68–0.69 → bullish recovery → breakout above 0.73–0.74 → Wave 5 extension toward 0.79–0.82.
The bullish scenario remains valid while the major support structure holds, but confirmation through price action and momentum is essential before treating the Wave 5 projection as fully confirmed.


The XAUUSD H4 chart is showing an interesting potential bullish reversal structure after a significant decline from the 4,650–4,690 region toward the 4,080–4,085 area....

If you are deciding between CFD and forex trading, understanding the differences between the two is an important first step.


Get the FXGT App


