Important Note!
We use cookies to ensure you get the best experience on our website.
By clicking ‘Agree,’ you accept our use of cookies as outlined in our cookies policy

Introduction
The USDX Weekly chart is showing an increasingly interesting bullish structure after the Dollar Index formed a potential major Wave C low around the 95.00–96.00 area.
Following the decline from the previous major high around 114.00–115.00, USDX developed a large corrective A-B-C structure. Wave A pushed the index lower toward approximately 99.00, followed by a recovery in Wave B toward the 109.00–110.00 region. Wave C then resumed the decline and brought USDX toward approximately 95.00–96.00.
This Wave C area is important because it could represent the completion of the larger corrective structure.
From that low, USDX began developing a new bullish structure. On the right side of the chart, price is forming a smaller 1-2-3-4-5 structure, which appears to be developing as a diagonal pattern.
The chart currently shows an initial target around 103.70–104.00, followed by a larger projected target around 108.00–109.00, which corresponds closely with the 261.8% Fibonacci extension.
Therefore, the main structure being monitored is:
Wave C low → Wave (i) → Wave (ii) → Wave (iii) toward 108.00–109.00.
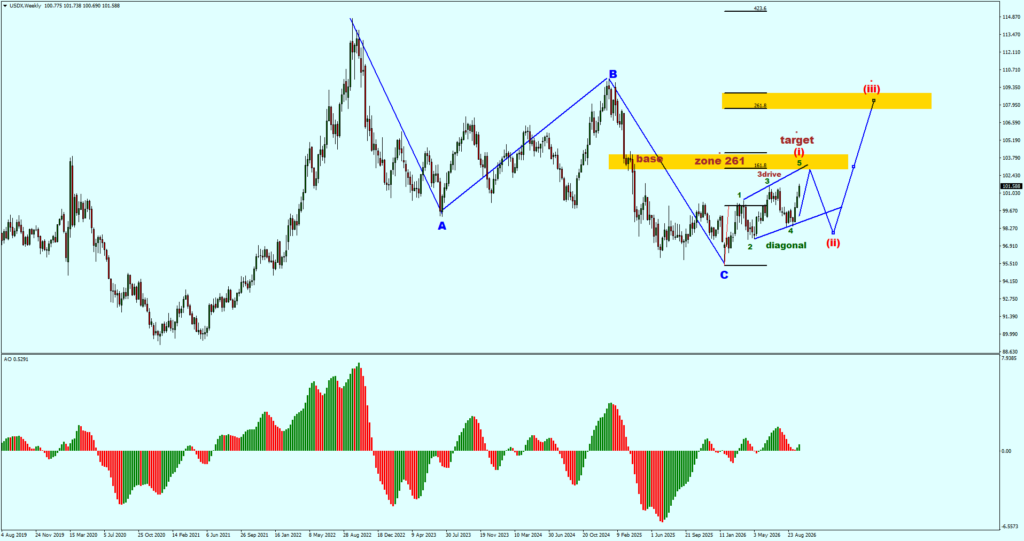
Major Elliott Wave Structure
Wave A – Beginning of the Major Decline
The larger structure began with a significant decline from the previous peak around:
113.50–114.00
Price then moved aggressively lower toward approximately:
99.00–100.00
This movement is labelled Wave A on the chart.
Wave A represented the first major bearish leg of the larger corrective structure.
Wave B – Recovery Toward 109.00–110.00
After Wave A was completed, USDX staged a strong recovery.
Price advanced from approximately 99.00 toward the:
109.00–110.00
region.
This movement formed Wave B.
However, the recovery eventually failed to continue higher, and the market reversed lower to form the final leg of the larger corrective structure.
Wave C – Decline Toward the Major Low
Wave C developed as another significant bearish movement and eventually brought USDX toward:
95.00–96.00
This region became an important major low on the Weekly chart.
The subsequent recovery from this area is significant because it suggests that the large ABC correction may have reached completion. If the interpretation is correct, the 95.00–96.00 region could represent the starting point of a new bullish cycle.
Beginning of the New Bullish Structure
After reaching the Wave C low around 95.00–96.00, USDX began to show a change in market structure.
Price started producing a series of higher lows and higher highs.
On the right side of the chart, the smaller bullish structure is labelled:
1 → 2 → 3 → 4 → 5
This structure appears to be developing as a diagonal.
The diagonal structure is important because it can represent the early stages of a larger bullish trend.
If the pattern develops successfully and price breaks above the upper boundary with strong momentum, it could transition into a stronger impulsive advance.
Diagonal Structure
Wave 1
Wave 1 began after USDX established the major low around 95.00–96.00.
Price then advanced toward the 100.00 region.
This was the initial bullish leg and established the foundation for the smaller bullish structure.
Wave 2
After Wave 1, USDX experienced a pullback that formed Wave 2.
Importantly, the correction did not break the major low.
Instead, price maintained a higher-low structure.
This is an important characteristic because as long as the Wave 2 correction does not invalidate the starting point of Wave 1, the bullish interpretation remains technically possible.
Wave 3
Price subsequently moved higher again and developed Wave 3, reaching approximately the 101.00–102.00 area.
This movement demonstrated that bullish momentum was beginning to strengthen.
The higher high also supported the idea that the market was gradually transitioning away from the previous bearish structure.
Wave 4
After Wave 3, USDX experienced another corrective movement, forming Wave 4.
The correction remained within the developing diagonal structure and did not destroy the overall sequence of higher lows.
This allowed the market to attempt another bullish advance.
Wave 5
The next bullish movement formed Wave 5, completing the smaller five-wave structure shown on the chart.
This area is important because the completion of the smaller structure could potentially mark the transition into a larger-degree bullish sequence.
The next major question is whether the market can break through the 103.70–104.00 Base Zone.
Base Zone and Fibonacci 261.8%
The chart identifies an important Base Zone around:
103.00–104.00
This area has several technical characteristics.
First, it represents a previous resistance area.
Second, the Fibonacci structure shows important 161.8% and 261.8% extensions around the projected path.
Third, the chart specifically identifies a potential Wave (i) target around 103.70–104.00.
Therefore, this zone could become an important decision area.
The preferred bullish structure would be:
Breakout → Retest of Base Zone → Support Holds → Wave (iii) Continuation.
Wave (i) Target: 103.70–104.00
The first major projected target on the chart is approximately:
103.70–104.00
This area is labelled as the potential Wave (i) target.
It is important because price could encounter resistance here after completing the initial bullish leg.
If a rejection occurs around this region, it would not necessarily mean that the bullish structure has failed.
Instead, the rejection could represent the beginning of Wave (ii).
Wave (ii) – Potential Pullback
After Wave (i) reaches the 103.70–104.00 area, the chart projects a potential Wave (ii) correction.
This pullback would be important because it could provide a test of whether the breakout has genuine underlying support.
A healthy bullish structure would ideally show:
Wave (i) completion → Wave (ii) pullback → Higher Low → Wave (iii) continuation.
If USDX declines but maintains the important higher-low structure, the bullish Elliott Wave interpretation remains intact.
However, if the pullback becomes excessively deep and destroys the developing bullish structure, the Wave (iii) projection would need to be reassessed.
The most important target shown on the chart is the upper yellow zone around:
108.00–109.00
This area corresponds closely with the 261.8% Fibonacci extension.
The chart specifically labels the projected movement as Wave (iii).
Therefore, the expected sequence is:
Wave (i) → Wave (ii) → Wave (iii) toward 108.00–109.00.
From an Elliott Wave perspective, Wave (iii) is typically associated with strong directional momentum.
If USDX successfully breaks out of the current diagonal structure and maintains bullish momentum, the move toward 108.00–109.00 becomes a technically significant scenario.
Fibonacci plays an important role in the projected USDX structure.
Fibonacci 161.8%
The 161.8% Fibonacci extension is located around the 103.70–104.00 area.
This coincides with the projected Wave (i) target and the Base Zone.
Therefore, 103.70–104.00 represents the first major resistance area to monitor.
A successful breakout above this level would increase the probability of further upside.
Fibonacci 261.8%
The 261.8% Fibonacci extension is positioned around:
108.00–109.00
This coincides with the projected Wave (iii) target.
The convergence between Elliott Wave and Fibonacci therefore makes this area one of the most important upside targets on the Weekly chart.
Fibonacci 423.6%
The chart also shows a much larger 423.6% Fibonacci projection around:
114.50–115.00
This is a longer-term projection and should not be treated as the immediate target.
USDX would first need to complete the projected Wave (i), Wave (ii), and Wave (iii) structure before the higher-degree target could be considered.
The chart also identifies a 3-Drive Pattern within the smaller bullish structure.
This pattern provides another indication that price is gradually developing a sequence of higher lows and higher highs.
The 3-Drive structure is particularly interesting because it appears after USDX established the major low around 95.00–96.00.
If this pattern continues to produce higher highs, it would support the interpretation that the previous bearish cycle has lost control and that USDX is developing a new bullish phase.
The Awesome Oscillator (AO) on the Weekly chart provides additional information about the changing momentum.
During the major decline toward Wave C, AO moved deeply into negative territory.
The red histogram expanded significantly as bearish momentum accelerated.
However, after USDX reached the 95.00–96.00 area, the negative AO histogram gradually weakened.
The bearish momentum began to contract, and AO subsequently moved back toward the zero line.
On the right side of the chart, AO has started to produce several small green bars.
This indicates that bullish momentum is beginning to return, although it is not yet as strong as the momentum seen during the previous major bullish phases.
The next important development would be whether AO begins producing a sustained series of larger green bars as USDX approaches and breaks the 103.70–104.00 Base Zone.
If bullish AO momentum expands together with a price breakout, it would provide stronger confirmation for the potential Wave (iii) advance.
From a fundamental perspective, recent USD strength has been supported by several important factors, including Treasury yields, interest-rate expectations and safe-haven demand.
However, Federal Reserve policy remains an important variable for the Dollar Index.
A stronger-than-expected U.S. economy and higher-for-longer interest-rate expectations could continue supporting USDX.
Conversely, weaker economic data and expectations of additional Federal Reserve easing could limit the upside and create pressure on the Dollar Index.
Therefore, the technical structure should be monitored together with:
These factors could influence whether USDX successfully breaks the 103.70–104.00 resistance area and develops the projected Wave (iii).
Scenario 1 – Breakout Above 103.70–104.00 and Wave (iii) Begins
This is the primary bullish scenario shown on the chart.
If USDX breaks above 103.70–104.00 with a strong Weekly candle and increasing bullish momentum, the market could enter the next major impulsive phase.
The primary target would be:
108.00–109.00
This area corresponds with the 261.8% Fibonacci extension and the projected Wave (iii) target.
Scenario 2 – Breakout Followed by a Retest of the Base Zone
After breaking above 103.70–104.00, USDX could return to retest the same area.
If the former resistance becomes support, this would provide stronger confirmation that the breakout is genuine.
The preferred structure would therefore be:
Breakout → Retest 103.70–104.00 → Support Holds → Wave (iii) → 108.00–109.00.
This would represent a healthier technical structure because the breakout would be confirmed through a successful retest.
Scenario 3 – Rejection and a Deeper Wave (ii) Pullback
If USDX fails to break the Base Zone and experiences a strong rejection, the market could develop a deeper Wave (ii) correction.
In this situation, the key consideration would be whether USDX continues to maintain a higher-low structure.
As long as the major bullish structure remains intact, the pullback could still represent a corrective phase rather than the beginning of a new bearish trend.
However, a deeper-than-expected correction would delay the projected Wave (iii) advance.
Structural Invalidation
The current bullish interpretation would weaken if USDX fails to maintain the developing higher-low structure after Wave (i).
A decisive breakdown through the lower boundary of the diagonal structure would reduce confidence in the projected bullish continuation.
The most important major structural area remains the 95.00–96.00 region.
If USDX were to return below this major low, the interpretation that Wave C has completed and that a new bullish cycle has begun would become significantly weaker.
Therefore, the market should be monitored in stages rather than assuming that the 108.00–109.00 target will automatically be reached.
| Price Level | Technical Significance |
| 114.50–115.00 | Fibonacci 423.6% / longer-term projection |
| 108.00–109.00 | Major Wave (iii) target / Fibonacci 261.8% |
| 103.70–104.00 | Base Zone / Wave (i) target / Fibonacci 161.8% |
| 101.50–102.00 | Current bullish structure / Wave 5 area |
| 99.50–100.00 | Initial structural support |
| 95.00–96.00 | Major low / Wave C |
| 91.00–93.00 | Lower support if the bullish structure fails |
The USDX Weekly chart is presenting an interesting bullish structure after the Dollar Index formed a potential Wave C low around 95.00–96.00.
The major structure can be interpreted as:
Wave A → Wave B → Wave C
with Wave C potentially completing the larger corrective phase.
Following that major low, USDX began developing a new bullish structure:
Wave 1 → Wave 2 → Wave 3 → Wave 4 → Wave 5.
The smaller structure also appears to be developing as a diagonal, while the chart identifies a 3-Drive Pattern within the bullish formation.
The immediate focus is the:
103.70–104.00 Base Zone.
This area represents an important technical resistance zone and is also associated with the projected Wave (i) target and the 161.8% Fibonacci extension.
If USDX successfully breaks above this area and subsequently holds it as support, the bullish structure would become considerably stronger.
The projected path would then be:
Wave (i) → Wave (ii) pullback → Wave (iii) → 108.00–109.00.
The 108.00–109.00 region is particularly significant because it corresponds with the 261.8% Fibonacci extension and the projected Wave (iii) target.
The longer-term 114.50–115.00 area represents the 423.6% Fibonacci projection, but this should only be considered after the market successfully develops the intermediate Elliott Wave structure.
Overall, the chart presents a potentially bullish USDX setup, but the key confirmation remains the market’s reaction around 103.70–104.00.
Primary chart structure:
Wave C low around 95.00–96.00 → bullish diagonal → Wave (i) toward 103.70–104.00 → Wave (ii) pullback → Wave (iii) toward 108.00–109.00.


The XAUUSD H4 chart is showing an interesting potential bullish reversal structure after a significant decline from the 4,650–4,690 region toward the 4,080–4,085 area....

The AUDUSD weekly chart continues to show an interesting bullish Elliott Wave structure following the strong recovery from the previous major low.

Get the FXGT App


