Important Note!
We use cookies to ensure you get the best experience on our website.
By clicking ‘Agree,’ you accept our use of cookies as outlined in our cookies policy

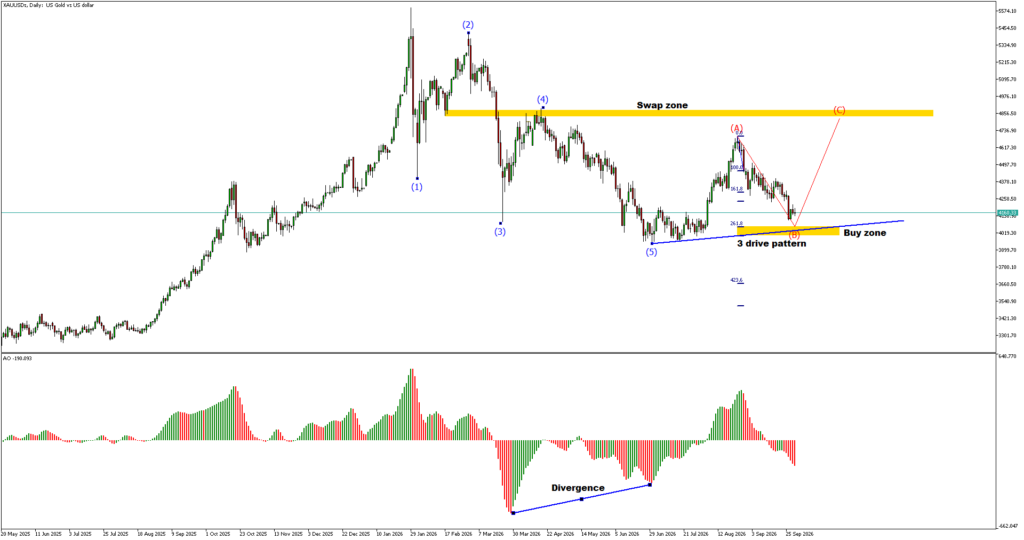
The XAUUSD Daily chart is showing a potentially important recovery structure after gold experienced a major decline from the previous high around the 5,450–5,550 region.
Based on the Elliott Wave structure marked on the chart, the previous major movement developed through Wave (1), Wave (2), Wave (3), Wave (4), and Wave (5). Wave (5) eventually reached the lower region around 3,900–4,000, where selling pressure began to weaken and a new recovery structure emerged.
On the right side of the chart, price has formed a smaller ABC corrective structure. Wave (A) advanced toward approximately 4,700–4,750, followed by a decline forming Wave (B) toward the 4,000–4,100 region.
Importantly, this Wave (B) area coincides with the marked Buy Zone and the developing 3-Drive Pattern.
If the 4,000–4,100 area successfully holds, the current structure allows for a potential Wave (C) recovery toward the upper Swap Zone around 4,850–4,900.
As of October 1, 2026, spot gold was around $4,155.60 per ounce, according to Reuters, while December U.S. gold futures were around $4,185.50. Gold had also declined more than 6% during September, making the current support area particularly important from a technical perspective.
Wave (1) – Initial Bullish Expansion
The earlier structure began with a strong bullish movement that developed into Wave (1).
This move represented the first major bullish expansion from the lower price area and established the initial leg of the larger Elliott Wave structure.
After Wave (1) was completed, the market entered a corrective phase.
Wave (2) – Corrective Recovery
Following Wave (1), gold moved through a correction before eventually forming Wave (2) around the 5,350–5,450 region.
This became an important turning point before the market entered a much larger bearish movement.
Wave (3) – Major Bearish Decline
Wave (3) developed as a strong downward movement.
Gold declined from the upper region around 5,300–5,400 toward approximately 4,250–4,300.
The strength and duration of this decline indicate that Wave (3) represented one of the major bearish legs within the larger structure.
Wave (4) – Corrective Recovery
After Wave (3), gold staged a recovery and formed Wave (4).
This recovery brought price back toward the 4,800–4,900 area.
The same region is now highlighted on the chart as the Swap Zone, making it an important historical resistance area for any future recovery.
Wave (5) – Final Decline Toward the Major Low
Following Wave (4), price resumed its decline and formed Wave (5).
The move eventually brought gold toward the 3,900–4,000 region.
This area became an important base from which the subsequent recovery developed.
The completion of Wave (5) is therefore important because the current ABC structure appears to have developed after this major bearish sequence.
After the completion of Wave (5), the chart shows a potential ABC recovery structure.
This structure is particularly important because it provides the framework for the current bullish scenario.
Wave (A) – First Recovery Leg
Gold rallied strongly from the lower region around 4,000 and advanced toward approximately:
4,700–4,750
This movement is labelled Wave (A) on the chart.
The rally was accompanied by a significant improvement in momentum, with the Awesome Oscillator moving strongly upward into positive territory.
Wave (B) – Current Correction
After reaching the Wave (A) high, gold began a corrective decline.
Price gradually moved lower and eventually returned toward the:
4,000–4,100
region.
This area is clearly marked as the Buy Zone.
The correction also appears to be developing around a 3-Drive Pattern, which increases the technical importance of the current area.
If the structure holds, the current decline could represent the final stages of Wave (B) before Wave (C) begins.
One of the most important features visible on the chart is the 3-Drive Pattern developing around the lower price region.
The blue rising structure connects the relevant swing lows and indicates that price is attempting to establish a base.
The pattern becomes more significant because it is appearing near:
This combination provides a technical basis for monitoring a potential bullish reversal.
However, the pattern should still be confirmed through price action. A pattern alone does not guarantee that Wave (B) has already completed.
The most important area on the current chart is:
4,000–4,100
This region is explicitly marked as the Buy Zone.
It also overlaps with the potential Wave (B) termination area and the developing 3-Drive structure.
From an Elliott Wave perspective, this area is important because Wave (B) can act as the corrective leg before Wave (C) develops in the opposite direction.
Therefore, if gold maintains support around 4,000–4,100 and begins producing a bullish reversal, it could provide early confirmation that Wave (B) is completing.
A move back above the recent lower highs would further strengthen the possibility of a developing Wave (C).
The Fibonacci structure on the chart provides several important reference levels.
Fibonacci 100.0%
The 100.0% Fibonacci level is positioned around the 4,400–4,500 region.
This area can act as an intermediate resistance zone if gold begins recovering from the current Buy Zone.
A successful break above this area would allow the market to continue toward the higher Fibonacci projections.
Fibonacci 161.8%
The 161.8% Fibonacci level is located around the 4,300–4,350 region.
This represents an important intermediate level during a potential Wave (C) recovery.
Price may experience temporary rejection here before attempting another move higher.
Fibonacci 261.8%
The 261.8% Fibonacci level is positioned close to the 4,050–4,150 region.
This is particularly important because it overlaps with the current Buy Zone and the potential Wave (B) termination area.
The convergence between Fibonacci and price structure makes this zone technically significant.
Fibonacci 423.6%
The 423.6% Fibonacci level is located much lower, around the 3,600–3,700 region.
This represents a deeper reference level and would become more relevant if the current bullish structure fails and gold continues significantly lower.
The red projection on the chart illustrates the potential path for Wave (C).
The projected structure is:
Wave (B) around 4,000–4,100 → Wave (C) toward 4,850–4,900
This represents a substantial recovery, but the target is consistent with the structure drawn on the Daily chart.
The projected Wave (C) target also coincides with the previously identified Swap Zone, making the upper region particularly important.
Therefore, 4,850–4,900 should be treated as a major technical target and resistance area rather than assuming that price will automatically continue higher once it reaches the zone.
Swap Zone: 4,800–4,900
The large yellow zone at the top of the chart is identified as the Swap Zone.
This area is approximately:
4,800–4,900
The zone has historical significance within the visible price structure and could become a major resistance area if the recovery develops.
If Wave (C) reaches this region, traders should monitor price action carefully for:
A strong breakout above the Swap Zone would require a separate reassessment of the structure.
The Awesome Oscillator (AO) provides an important confirmation layer for the current structure.
During the previous major bearish movement, AO moved deeply into negative territory, reflecting strong selling momentum.
However, the chart shows a significant bullish divergence around the major lows.
Price was producing downward pressure while AO momentum was no longer confirming the same degree of bearish strength.
This divergence was followed by a substantial bullish recovery.
During Wave (A), AO expanded strongly into positive territory, confirming the acceleration in bullish momentum.
As Wave (B) developed, however, AO reversed lower and returned toward negative territory.
This indicates that bearish momentum has returned during the current correction.
The important development to monitor now is whether AO begins to show:
Red bars weakening → bearish momentum declining → green bars appearing → bullish momentum expanding.
If this sequence develops around the 4,000–4,100 Buy Zone, it would provide additional confirmation for a potential Wave (C) recovery.
Scenario 1 – Wave (B) Completes and Wave (C) Begins
The primary structure shown on the chart is that gold could complete Wave (B) around the 4,000–4,100 Buy Zone.
If price successfully holds this region and produces a bullish reversal, Wave (B) may be considered complete.
The recovery could then progress through several stages:
4,100 → 4,300–4,350 → 4,450–4,500 → 4,700–4,750 → 4,850–4,900
The move does not necessarily need to happen in a straight line.
Intermediate pullbacks and consolidations can occur while Wave (C) develops.
Scenario 2 – Initial Rejection During the Recovery
Gold may initially recover from the Buy Zone but encounter resistance around 4,300–4,350 or 4,450–4,500.
A rejection at these intermediate levels would not automatically invalidate the Wave (C) scenario.
If price continues to form higher lows after the rejection, the broader bullish recovery structure could remain intact.
Therefore, the reaction around each intermediate resistance level should be evaluated according to the subsequent price structure.
The major risk to the bullish structure is a decisive breakdown below:
4,000–4,100
If gold breaks below this zone with strong bearish momentum, Wave (B) may not yet be complete.
Price could then search for a deeper support level before attempting another reversal.
The 3,900–4,000 region becomes particularly important because it is close to the previous Wave (5) low.
A decisive break below this area would require a much deeper reassessment of the current bullish Wave (C) scenario.
The 4,000–4,100 region is the key structural area for the current bullish setup.
As long as price continues to hold this area and begins producing a meaningful reversal, the potential Wave (C) structure remains valid.
However, a strong daily breakdown below 4,000 would increase the probability that Wave (B) is still developing.
A deeper move below 3,900–4,000 would be even more significant because it approaches or breaks the previous Wave (5) low.
Under such conditions, the projected Wave (C) toward 4,850–4,900 would need to be reassessed.
| Price Level | Technical Significance |
| 4,850–4,900 | Major Wave (C) target / Swap Zone |
| 4,700–4,750 | Wave (A) high |
| 4,450–4,500 | Intermediate resistance / Fibonacci area |
| 4,300–4,350 | Fibonacci 161.8% area |
| 4,100–4,150 | Fibonacci 261.8% / initial resistance |
| 4,000–4,100 | Major Buy Zone / potential Wave (B) area |
| 3,900–4,000 | Major support / previous Wave (5) low |
| 3,600–3,700 | Fibonacci 423.6% reference area |
From a broader market perspective, gold entered October after a significant September decline.
Reuters reported on October 1 that spot gold was around $4,155.60, while September had produced a decline of more than 6%. Softer-than-expected U.S. inflation data reduced market expectations for an October Federal Reserve rate hike, providing some support for gold. However, rising U.S. Treasury yields and a stronger dollar continued to limit the upside.
This creates an important fundamental backdrop for the technical structure.
Therefore, while the chart presents a potential bullish Wave (C), the reaction of gold to upcoming U.S. economic data, Federal Reserve commentary, Treasury yields and the U.S. dollar remains important.
The September U.S. employment report was also scheduled for release on Friday, making the next major U.S. data releases potentially important for gold volatility.
The XAUUSD Daily chart is currently presenting an interesting technical structure after the completion of a major five-wave decline.
The larger structure shows:
Wave (1) → Wave (2) → Wave (3) → Wave (4) → Wave (5)
followed by a potential corrective recovery:
Wave (A) → Wave (B) → potential Wave (C).
The current Wave (B) area is particularly important because it overlaps with several technical elements:
4,000–4,100 Buy Zone + 3-Drive Pattern + Fibonacci 261.8% + previous structural support.
If this area successfully holds and bullish momentum returns, the chart provides a potential path toward:
Wave (C) → 4,850–4,900
with the 4,800–4,900 Swap Zone representing the major resistance and target area.
The key confirmation would be a sustained bullish reversal from the Buy Zone, accompanied by improving price structure and a recovery in Awesome Oscillator momentum.
At the same time, a decisive break below 4,000, particularly if followed by a break of 3,900–4,000, would weaken the current bullish Wave (C) interpretation and require the Elliott Wave count to be reassessed.
Primary chart structure:
4,000–4,100 Buy Zone → Wave (B) completion → bullish reversal → Wave (C) → 4,850–4,900 Swap Zone.


The XAUUSD H4 chart is showing an interesting potential bullish reversal structure after a significant decline from the 4,650–4,690 region toward the 4,080–4,085 area....

The AUDUSD weekly chart continues to show an interesting bullish Elliott Wave structure following the strong recovery from the previous major low.

Get the FXGT App


