Important Note!
We use cookies to ensure you get the best experience on our website.
By clicking ‘Agree,’ you accept our use of cookies as outlined in our cookies policy

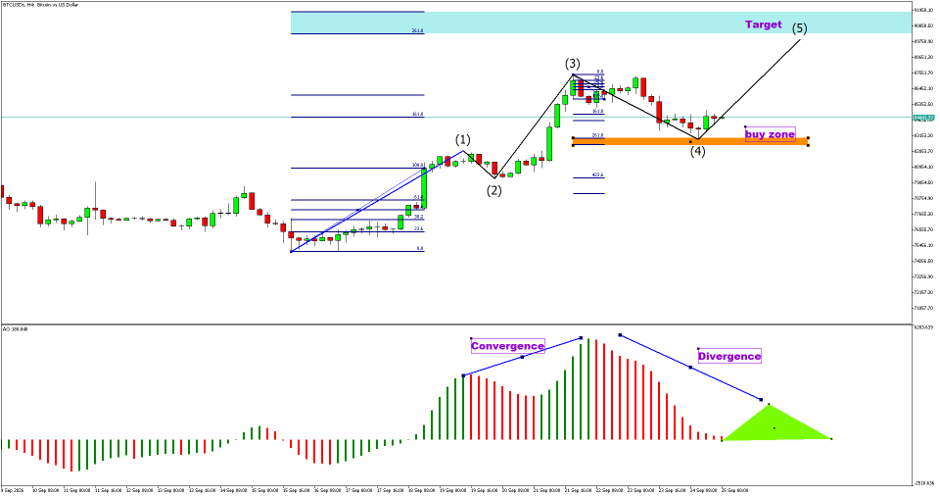
The BTCUSD H4 chart shows a potentially developing five-wave Elliott Wave structure, with Bitcoin currently undergoing a corrective phase following the strong advance of Wave (3).
Based on the structure displayed on the chart, Bitcoin has completed or is close to completing Wave (1), followed by Wave (2), before accelerating higher through Wave (3).
After reaching the Wave (3) high, price began a corrective decline that is currently labelled as Wave (4).
The most important feature on the chart is the highlighted buy zone around 82,000–83,000. This area could potentially provide support for the completion of Wave (4), allowing Bitcoin to resume its broader bullish structure through Wave (5).
The projected Wave (5) target is located around 90,000–91,000, close to the 261.8% Fibonacci projection marked on the chart.
The overall Elliott Wave roadmap is therefore:
Wave (1) ↑ → Wave (2) ↓ → Wave (3) ↑ → Wave (4) ↓ → Wave (5) ↑
This structure suggests that the current decline may represent a corrective phase rather than necessarily the end of the broader bullish sequence.
Wave (1) – Initial Bullish Impulse
The first major bullish movement began from the lower region around 75,000–76,000.
From this area, Bitcoin started producing a sequence of higher highs and higher lows, indicating that bullish momentum was beginning to develop.
The advance eventually formed Wave (1) around the 80,000–81,000 region.
This first wave established the foundation for the larger impulsive structure currently visible on the H4 chart.
Wave (2) – Initial Corrective Phase
Following the completion of Wave (1), Bitcoin experienced a corrective decline labelled as Wave (2).
The correction remained relatively contained and did not destroy the developing bullish structure.
After finding support, buyers returned to the market and Bitcoin began another stronger upward movement.
This subsequent acceleration became the foundation for the much larger Wave (3).
Wave (3) – Strong Bullish Expansion
Wave (3) represents the strongest bullish phase visible on the chart.
Bitcoin accelerated higher and broke through several previous resistance areas with strong momentum.
The price eventually reached approximately 87,000–88,000, where the chart marks the completion of Wave (3).
The strength of this move is also reflected in the Awesome Oscillator (AO).
During the Wave (3) advance, the AO produced a series of expanding green bars, indicating that bullish momentum was increasing alongside the price. This combination of price expansion and momentum expansion supports the interpretation of Wave (3) as the dominant bullish impulse within the current structure.
Wave (4) – Correction Toward the Buy Zone
After reaching the Wave (3) high, Bitcoin began to retrace lower.
The chart shows a series of lower short-term movements, forming the corrective structure labelled Wave (4).
This correction is now approaching the orange area identified as the:
BUY ZONE
The zone is located approximately around 82,000–83,000.
This area is important because it may provide the support required for Wave (4) to complete before Bitcoin attempts another bullish advance through Wave (5).
From an Elliott Wave perspective, a correction after a strong Wave (3) is a normal part of a five-wave impulsive sequence.
Therefore, the current decline does not automatically mean that the broader bullish structure has failed.
Instead, the market may be undergoing a corrective reset before the next potential bullish phase.
The 82,000–83,000 area is the most important zone shown on the current chart.
There are several reasons why this area deserves close attention.
First, the chart specifically identifies it as the buy zone for the potential completion of Wave (4).
Second, the zone is positioned near the Fibonacci projection structure marked on the chart, including the 261.8% level associated with the corrective structure.
Third, price has already shown reactions around this region, making the area important for determining whether buyers are prepared to defend the support.
If Bitcoin enters this zone and produces a strong bullish reaction, it could provide an early indication that Wave (4) is approaching completion.
However, simply touching the buy zone should not be treated as confirmation that Wave (4) has already finished.
Additional confirmation would be stronger if price begins to produce:
The chart highlights several Fibonacci levels throughout the Elliott Wave structure.
The most important projection for the current setup is the 261.8% Fibonacci level, which is positioned close to the projected Wave (5) target.
The upper target zone is approximately 90,000–91,000.
This creates the following projected sequence:
Wave (4) correction → support → Wave (5) advance → 261.8% Fibonacci target
The 261.8% level should be treated as a technical projection rather than a guaranteed destination.
Bitcoin may react before reaching the exact Fibonacci level, while a strong bullish breakout could also push price beyond the projected target.
Therefore, the reaction around 90,000–91,000 would become important if Wave (5) develops.
Wave (5) – Potential Target Around 90,000–91,000
The chart clearly projects a final bullish leg from the Wave (4) area toward the upper target zone.
This projected movement is labelled:
Target (5)
The target is located approximately around 90,000–91,000.
If the Wave (4) correction finds support around 82,000–83,000 and Bitcoin subsequently establishes a new bullish structure, Wave (5) could potentially develop toward this target area.
The projected roadmap would therefore be:
Wave (4) completes → bullish reversal → Wave (5) develops → 90,000–91,000 target
The key confirmation would be whether price can break out of the corrective structure and begin producing a sequence of higher highs and higher lows.
The Awesome Oscillator (AO) provides an important additional perspective on the current Elliott Wave structure.
During the earlier bullish advance, AO expanded significantly into positive territory.
The green bars increased in size as Bitcoin accelerated higher, showing that bullish momentum was strengthening during the formation of Wave (3).
However, after the Wave (3) peak, the AO began to decline.
The histogram gradually became smaller, while the price remained relatively elevated.
The chart specifically highlights this condition as:
This divergence suggests that bullish momentum has weakened compared with the strength seen during the earlier part of the rally.
However, divergence by itself does not necessarily mean that the entire bullish trend has ended.
Within an Elliott Wave structure, momentum divergence near the completion of Wave (3) can occur before a Wave (4) correction.
Therefore, the current AO behaviour is consistent with the possibility that Bitcoin is undergoing a corrective Wave (4) before potentially attempting another bullish move through Wave (5).
The chart also highlights a period of convergence in the AO during the earlier stages of the bullish movement.
As price began moving higher, momentum also increased.
The AO progressively expanded into positive territory while Bitcoin advanced from the lower price region toward Wave (3).
This combination of price and momentum expansion supported the development of the bullish impulsive structure.
The sequence can therefore be viewed as:
Bullish price expansion → increasing AO momentum → Wave (3) acceleration → momentum divergence → Wave (4) correction
This provides useful context for understanding why the current decline may be interpreted as a corrective phase rather than immediately as a complete trend reversal.
BTCUSD Trading Scenarios
Scenario 1 – Wave (4) Completes Inside the Buy Zone
The primary scenario shown on the chart is for Bitcoin to continue correcting toward the 82,000–83,000 buy zone.
If this area holds and produces a clear bullish reaction, Wave (4) could potentially be completed.
The projected structure would then become:
82,000–83,000 support → Wave (4) completion → bullish reversal → Wave (5) → 90,000–91,000
Confirmation would become stronger if Bitcoin forms a higher low and subsequently breaks above nearby short-term resistance.
A successful breakout would suggest that buyers are beginning to regain control following the Wave (4) correction.
Scenario 2 – Wave (4) Correction Extends Lower
If Bitcoin enters the buy zone but fails to generate a meaningful bullish reaction, Wave (4) may not yet be complete.
The correction could extend toward lower support levels before the market establishes a sustainable bottom.
In this situation, traders should avoid assuming that the first touch of the buy zone automatically represents the end of Wave (4).
Price action inside and below the zone would become important in determining whether the Elliott Wave structure remains valid.
Scenario 3 – Early Bullish Reversal
Bitcoin may also begin recovering before reaching the deeper part of the projected buy zone.
If price breaks above the immediate corrective structure and starts producing higher highs and higher lows, this could indicate that Wave (4) has already completed at a higher level.
Under this scenario, Bitcoin could begin developing Wave (5) earlier than expected.
The next major objective would remain the projected 90,000–91,000 target zone.
| Price Area | Technical Significance |
| 87,000–88,000 | Wave (3) high / major resistance |
| 84,000–85,000 | Current trading and short-term reaction area |
| 82,000–83,000 | Major buy zone / potential Wave (4) support |
| 90,000–91,000 | Projected Wave (5) target |
| 261.8% | Major Fibonacci projection |
The chart itself places current price around the mid-84,000 area, while market data on September 24–25 also shows BTCUSD trading around the mid-84,000s, with recent highs near 87,000 and recent lows around 83,000.
The Elliott Wave interpretation remains dependent on Bitcoin respecting the key structural areas shown on the chart.
If Bitcoin breaks decisively below the projected Wave (4) support structure and continues producing lower lows, the assumption that Wave (4) is close to completion would become weaker.
A sustained breakdown through the key support area would require the current Elliott Wave count to be reassessed.
Likewise, if Bitcoin breaks strongly above the Wave (3) high before completing the expected correction, the current Wave (4) interpretation would need to be reconsidered because the market would be showing stronger bullish behaviour than projected.
Therefore, the Wave (4) buy zone should be viewed as a technical area of interest, not as an automatic entry signal.
Confirmation from price action remains essential.
The BTCUSD H4 chart currently shows a potentially developing five-wave Elliott Wave structure.
Bitcoin has already formed a strong Wave (3) advance toward the 87,000–88,000 region and is now undergoing a corrective phase labelled as Wave (4).
The correction is approaching the highlighted 82,000–83,000 buy zone, which could potentially act as the support area for the completion of Wave (4).
At the same time, the Awesome Oscillator shows a clear reduction in bullish momentum after Wave (3), with the chart identifying a divergence between price and momentum. This divergence is consistent with the possibility of a Wave (4) correction but does not, by itself, confirm that the larger bullish structure has ended.
If the 82,000–83,000 zone successfully holds and Bitcoin produces a bullish reversal with confirmation from price structure and momentum, the next potential phase would be Wave (5).
The projected Wave (5) target is approximately 90,000–91,000, close to the 261.8% Fibonacci projection shown on the chart.
The overall technical roadmap is therefore:
Wave (3) completed → Wave (4) correction → 82,000–83,000 buy zone → bullish reversal → Wave (5) → 90,000–91,000 target.
The key area to monitor is therefore the reaction around 82,000–83,000. A strong bullish response from this zone would provide important evidence that the corrective phase may be nearing completion, while a sustained breakdown would require the current Elliott Wave structure to be reassessed.
As with any Elliott Wave projection, the structure remains dynamic and should be confirmed through actual price action rather than relying on the wave count alone.


What makes it possible for a trader to gain exposure to the S&P 500, gold, a major technology company, the US dollar, or Bitcoin, all from a single trading account? The a...


The cryptocurrency market remains in focus as Bitcoin stages a recovery despite significant ETF outflows, security concerns, and growing regulatory scrutiny.


Get the FXGT App


