Important Note!
We use cookies to ensure you get the best experience on our website.
By clicking ‘Agree,’ you accept our use of cookies as outlined in our cookies policy

ABC Corrective Structure Remains the Main Focus
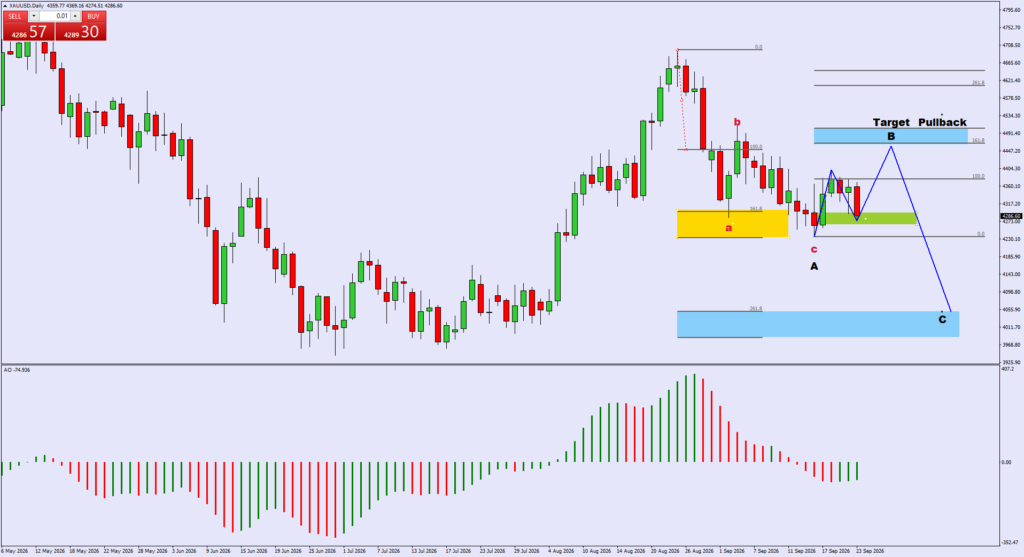
The XAUUSD Daily chart shows that price may be developing an A-B-C corrective structure following the decline from the recent high around the 4,700 area.
Based on the Elliott Wave count shown on the chart, Wave A appears to have formed the initial decline, while price is now attempting to develop Wave B, representing a temporary recovery before a potential continuation lower through Wave C.
Current price is trading around the 4,286 area, while the right side of the chart shows an attempt to establish a recovery from the Wave A support region.
This structure is important because the current rebound does not necessarily indicate the beginning of a new bullish trend. Instead, it may represent a corrective recovery within the larger bearish ABC structure.
The broader roadmap remains:
Wave A ↓ → Wave B ↑ → Wave C ↓
This type of structure is consistent with the corrective Elliott Wave framework used to analyse the current XAUUSD setup.
Wave B May Target the Pullback Zone
The main zone highlighted on the chart is around 4,450–4,500, which represents the potential target area for Wave B.
This region is important because it coincides with a previous reaction area and the Fibonacci structure marked on the chart.
If XAUUSD manages to continue recovering from the current support area, the following levels become important:
A move toward these levels should still be viewed as a potential corrective pullback rather than automatic confirmation of a new bullish trend.
This distinction is important because a corrective Wave B can produce a relatively strong rebound before the market resumes its larger corrective decline.
Current Support Area Becomes Critical
Price is currently trading close to the green support zone highlighted on the chart.
This area is important because price has already reacted from this region following the Wave A decline.
As long as the current support structure remains intact, there is room for XAUUSD to develop a recovery toward the projected Wave B zone around 4,450–4,500.
However, if price fails to hold this support and breaks below the zone with strong bearish momentum, the Wave B interpretation would need to be reassessed.
In that situation, the market could potentially continue lower before completing a larger Wave B recovery.
Therefore, the immediate focus should remain on how price behaves around the current support area.
Wave C Becomes the Main Downside Target After Wave B
Once Wave B potentially reaches completion, the chart projects a possible Wave C decline.
The main Wave C target is located around the 261.8 Fibonacci extension, approximately in the 4,010–4,055 region based on the levels displayed on the chart.
This area is marked as the potential C target zone.
The projected structure is therefore:
Wave A ↓ → Wave B pullback ↑ → Wave C ↓
If price first reaches the Wave B zone around 4,450–4,500 and subsequently produces a clear bearish rejection, the ABC corrective structure would become more evident.
The reaction around the Wave B zone will therefore be particularly important.
A strong rejection could indicate that the temporary recovery is losing momentum and that sellers are attempting to regain control.
Fibonacci 261.8% Becomes an Important Target
The 261.8 Fibonacci extension is one of the key technical references in this setup.
The projected target area is approximately 4,010–4,055, where the chart identifies the potential completion area for Wave C.
However, a Fibonacci target should not be interpreted as a guaranteed price destination.
Price may react before reaching the exact Fibonacci level if strong support develops, while a temporary overshoot is also possible if bearish momentum becomes particularly strong.
For this reason, price action around the 4,010–4,055 region will be important.
Traders should monitor whether XAUUSD begins to show:
These factors can help determine whether the projected Wave C is approaching completion.
Awesome Oscillator Shows Bearish Momentum Remains
The Awesome Oscillator (AO) at the bottom of the chart remains below the zero line.
This indicates that the broader momentum is still carrying bearish pressure.
However, the latest negative AO bars appear smaller compared with the earlier bearish bars.
This suggests that bearish momentum may be losing some of its intensity.
Such a development can support the possibility of a short-term recovery, which would be consistent with the projected Wave B scenario.
Nevertheless, weakening bearish momentum does not automatically confirm a bullish reversal.
As long as AO remains below the zero line and price has not established a stronger bullish structure, bearish pressure should remain part of the analysis.
The most important confirmation will continue to come from price structure, support and resistance behaviour, and the development of the Elliott Wave pattern.
Main XAUUSD Scenarios
Scenario 1 — Wave B Pullback
If the current support area holds, XAUUSD could develop the following structure:
Current support → price rises → Wave B → 4,450–4,500 → bearish rejection → Wave C
This is the main corrective structure projected on the chart.
Under this scenario, the recovery toward 4,450–4,500 would represent a corrective rebound rather than confirmation of a new long-term bullish trend.
If price reaches the zone and begins forming lower highs or bearish rejection candles, attention would shift toward the potential Wave C decline.
Scenario 2 — Price Continues Lower
If the current support fails, XAUUSD could continue declining without developing a large Wave B rebound.
In this situation, the 4,200 region becomes an intermediate area to monitor, followed by the major projected Wave C target zone around 4,010–4,055.
A decisive breakdown would therefore require the current Elliott Wave count to be reassessed, particularly if price begins producing a series of lower lows.
Key Levels to Watch
Current Support:
4,270–4,300
Initial Resistance:
4,400
Potential Wave B Target:
4,450–4,500
Higher Resistance Area:
4,520–4,560
Potential Wave C Target:
4,010–4,055
Major Fibonacci Target:
261.8%
Invalidation and Structure Risk
The projected ABC structure remains dependent on price respecting the key support and resistance areas identified on the chart.
If XAUUSD produces a sustained bullish breakout well above the projected Wave B resistance area and continues establishing higher highs and higher lows, the bearish Wave C projection would need to be reassessed.
Likewise, an immediate breakdown through the current support area would weaken the expectation of a significant Wave B recovery.
Therefore, the Elliott Wave count should be treated as a dynamic structure, with confirmation coming from actual price action rather than the wave count alone.
Conclusion
The XAUUSD Daily chart continues to show a potential ABC corrective structure following the significant decline from the approximately 4,700 high.
Price is currently positioned around the 4,286 area, close to an important support zone that could potentially provide the foundation for a Wave B recovery.
If this support holds, XAUUSD could recover toward the 4,450–4,500 region, which represents the main projected Wave B pullback zone.
A bearish rejection from this area would then strengthen the possibility of a subsequent Wave C decline, with the major projected target located around 4,010–4,055, corresponding to the 261.8 Fibonacci extension.
The overall roadmap is:
Support holds → Wave B recovery → 4,450–4,500 → bearish rejection/pullback → Wave C decline → 4,010–4,055.
The key areas to monitor are therefore the 4,270–4,300 support zone, the 4,450–4,500 Wave B area, and the 4,010–4,055 Fibonacci 261.8 target zone.
This interpretation remains dependent on the price structure continuing to respect the projected Elliott Wave scenario.


The XAUUSD H4 chart is showing an interesting potential bullish reversal structure after a significant decline from the 4,650–4,690 region toward the 4,080–4,085 area....

If you are deciding between CFD and forex trading, understanding the differences between the two is an important first step.


Get the FXGT App


