Important Note!
We use cookies to ensure you get the best experience on our website.
By clicking ‘Agree,’ you accept our use of cookies as outlined in our cookies policy

The USDCAD Daily chart continues to show a developing bullish Elliott Wave structure, with price currently trading around the 1.4170–1.4190 area after a strong upward movement from the previous Wave 2 low around 1.3730–1.3750.
The current structure suggests that USDCAD may be approaching the later stages of Wave 3, with Fibonacci projections indicating an important resistance area around 1.4180–1.4200.
If Wave 3 begins to lose momentum around this region, the chart structure allows for a potential Wave 4 corrective pullback toward 1.4000–1.4050, followed by another bullish move in Wave 5 toward the projected 1.4430–1.4440 area, with approximately 1.4435 highlighted as the major target.
This technical structure is also broadly consistent with the recent market environment. Reuters reported that USD/CAD reached around 1.4175 on September 28, its weakest Canadian-dollar level since July 9, amid safe-haven demand for the U.S. dollar.
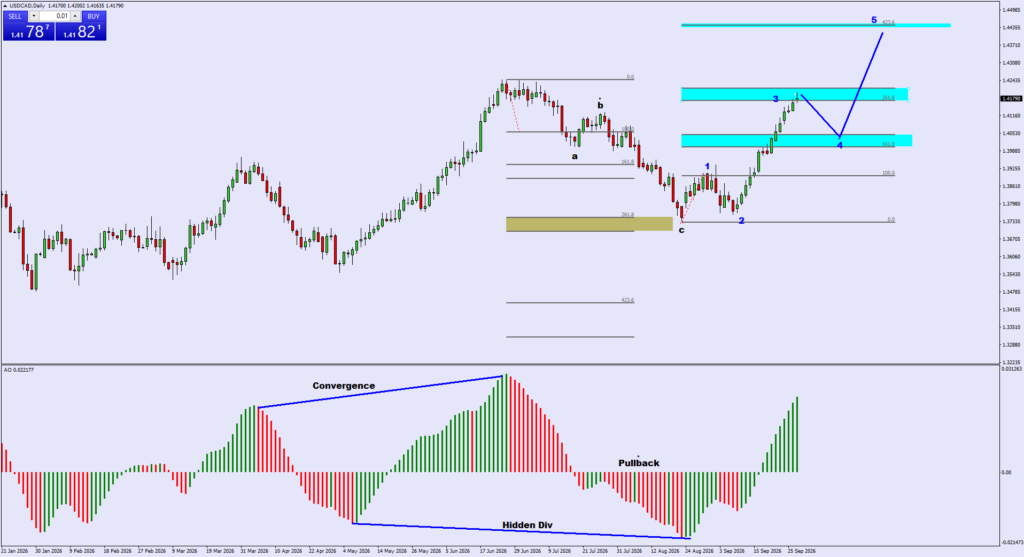
The overall Daily structure remains bullish based on the Elliott Wave count visible on the chart.
The previous correction established an important base around 1.3730–1.3750, from which USDCAD began a sustained upward movement.
The current price action can be interpreted as the development of a five-wave bullish sequence:
The immediate focus is therefore whether price can continue extending Wave 3 above the current resistance area or whether the market begins forming the next corrective phase.
Current external technical data also shows strong bullish momentum around the 1.4180 area, although several momentum indicators are approaching overbought conditions.
Elliott Wave Structure
Wave 1 – Initial Bullish Recovery
The first significant bullish movement began from the lower price region and pushed USDCAD toward approximately 1.3900.
This move established the initial bullish leg of the current Elliott Wave sequence.
At this stage, the move can be viewed as the beginning of a larger recovery structure rather than the completion of the entire bullish trend.
Wave 2 – Corrective Pullback
Following Wave 1, price experienced a corrective decline toward approximately 1.3730–1.3750.
This area became an important structural support zone.
The ability of price to hold this region was significant because the subsequent rally from this area generated a much stronger bullish impulse.
Wave 3 – Strong Bullish Expansion
Wave 3 is currently the most important active structure on the chart.
From the Wave 2 low around 1.3730–1.3750, USDCAD advanced strongly toward the 1.4170–1.4190 region.
The Fibonacci structure on the chart places an important 261.8% extension around the current Wave 3 area, making 1.4180–1.4200 a technically significant resistance zone.
If price continues to break higher without meaningful correction, Wave 3 could extend further. However, if rejection appears around this region, the chart would support the possibility of a Wave 4 retracement.
The 1.4180–1.4200 area is currently one of the most important zones to monitor.
This region corresponds closely with the current Wave 3 projection and Fibonacci extension structure.
A failure to sustain prices above this area could create the first indication that Wave 3 is becoming mature.
However, a clean daily breakout and sustained trading above 1.4200 could indicate that Wave 3 is extending rather than immediately transitioning into Wave 4.
Therefore, traders should distinguish between:
Rejection: Potential Wave 4 correction.
Breakout and continuation: Possible Wave 3 extension.
If Wave 3 completes or temporarily loses momentum around 1.4180–1.4200, the next structure to watch is a potential Wave 4 correction.
The chart projects the Wave 4 area around:
1.4000–1.4050
This zone is particularly important because it represents a potential retracement area following the strong Wave 3 advance.
A controlled decline into this region would not necessarily invalidate the bullish Elliott Wave structure.
Instead, it could represent a normal corrective phase before the market attempts another bullish leg.
The ideal structure would therefore be:
Wave 3 resistance → Wave 4 pullback → support around 1.4000–1.4050 → Wave 5 continuation.
Fibonacci extensions provide several important reference points on the chart.
261.8% Extension
The 261.8% Fibonacci extension is positioned around the current Wave 3 region, close to 1.4180.
This makes the current price area a significant technical checkpoint.
A rejection around this level would strengthen the possibility of a corrective Wave 4.
423.6% Extension
The larger projected Wave 5 target is located around the 423.6% Fibonacci extension, near:
1.4430–1.4440
with approximately 1.4435 highlighted as the major projected target.
This level represents a potential final extension area for the current five-wave bullish structure.
The Awesome Oscillator (AO) on the Daily chart provides additional information about the current momentum condition.
The chart shows an earlier period of bullish convergence, followed by a pullback and a subsequent recovery in momentum.
The recent AO histogram has turned increasingly positive, with green bars expanding toward the current price movement.
This suggests that bullish momentum remains active.
However, the key issue is whether this momentum can continue to support a breakout above 1.4180–1.4200, or whether momentum begins to weaken as Wave 3 reaches its projected extension.
A loss of AO momentum near resistance would therefore be important confirmation for a potential Wave 4 correction.
Scenario 1 – Wave 3 Rejection and Wave 4 Pullback
The first scenario is that USDCAD encounters resistance around 1.4180–1.4200.
If price fails to sustain the breakout and begins moving lower, the market could enter a Wave 4 corrective phase.
The main area to monitor would be:
1.4000–1.4050
A controlled correction into this zone could create the foundation for the next bullish Wave 5.
Scenario 2 – Wave 4 Support Holds and Wave 5 Begins
If price pulls back toward 1.4000–1.4050 and buyers successfully defend the zone, the bullish Elliott Wave structure remains intact.
A subsequent bullish reversal could then signal the beginning of Wave 5.
The major projected target would be:
1.4430–1.4440
with 1.4435 as the key reference level from the chart.
Scenario 3 – Wave 3 Continues Higher
Another possibility is that USDCAD does not produce a meaningful Wave 4 correction immediately.
Instead, price could break through 1.4200 and continue extending Wave 3.
In that situation, the 1.4180–1.4200 zone would change from resistance into an area that needs to hold as support after a breakout.
A sustained breakout would therefore delay the expected Wave 4 pullback.
The bullish Wave 4–Wave 5 scenario needs to be reassessed if the projected Wave 4 support area fails decisively.
The 1.4000–1.4050 zone is therefore an important structural area.
If price breaks below this region with strong bearish momentum, the expected Wave 4 structure may need to be reconsidered.
A deeper decline toward the previous structural areas around 1.3920–1.3930 would indicate that the correction is becoming larger than initially projected.
The major structural support remains around 1.3730–1.3750, which represents the previous Wave 2 region.
| Price Level | Technical Significance |
| 1.4430–1.4440 | Major projected Wave 5 target |
| 1.4435 | Key Fibonacci 423.6% target |
| 1.4180–1.4200 | Current Wave 3 resistance |
| 1.4000–1.4050 | Potential Wave 4 support zone |
| 1.3920–1.3930 | Previous structural area |
| 1.3730–1.3750 | Major Wave 2 support |
The USDCAD Daily chart continues to present a bullish Elliott Wave structure, with price currently trading near the projected Wave 3 resistance zone around 1.4180–1.4200.
The key question now is whether the pair can break and sustain above this resistance or whether Wave 3 begins to lose momentum and develops into a corrective Wave 4.
The primary chart structure suggests a potential sequence of:
Wave 3 resistance → Wave 4 pullback toward 1.4000–1.4050 → bullish reversal → Wave 5 toward 1.4430–1.4440.
The 1.4000–1.4050 zone is therefore the most important support area to monitor if the correction develops, while 1.4435 remains the major projected upside target on the current Elliott Wave structure.
From a broader market perspective, recent USD/CAD strength has occurred alongside renewed U.S.-dollar demand, while current technical readings continue to show strong bullish momentum around 1.4180.
Overall chart structure:
Wave 3 → potential Wave 4 pullback → Wave 5 toward 1.4435.


The XAUUSD H4 chart is showing an interesting potential bullish reversal structure after a significant decline from the 4,650–4,690 region toward the 4,080–4,085 area....

If you are deciding between CFD and forex trading, understanding the differences between the two is an important first step.


Get the FXGT App


