Important Note!
We use cookies to ensure you get the best experience on our website.
By clicking ‘Agree,’ you accept our use of cookies as outlined in our cookies policy

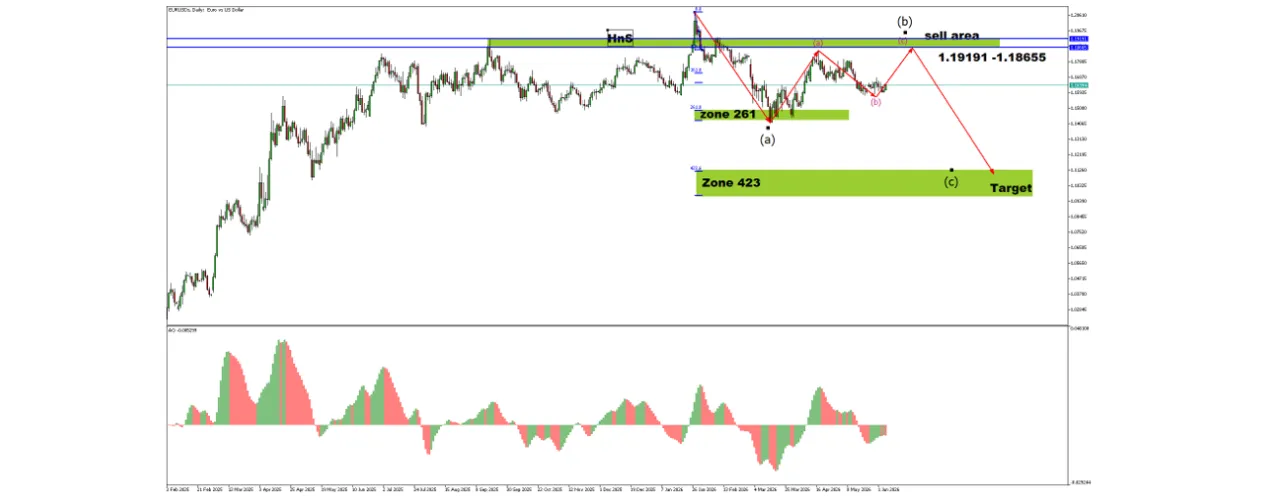
EUR/USD Daily Chart showing Elliott Wave structure and projected ABC correction.
EUR/USD remains under pressure after completing a strong impulsive advance from February through January highs. The pair has since entered a corrective phase, with price action suggesting that a larger ABC correction may be developing.
The recent decline successfully reached the Fibonacci 261.8 extension zone, where buyers temporarily regained control. However, the recovery appears corrective rather than impulsive, indicating that sellers may still dominate the broader structure.
The daily chart suggests that wave (a) has already completed near the Fibonacci 261.8 extension support zone.
A corrective rebound is currently unfolding and could form wave (b), targeting the major resistance area between:
This resistance zone coincides with:
As long as price remains below this resistance zone, the broader corrective outlook remains valid.
The preferred scenario is for EUR/USD to complete wave (b) before initiating wave (c) lower.
Expected sequence:
A rejection from the resistance area would strengthen the bearish outlook and increase the probability of a move toward the next major support region.
Downside Target
EUR/USD remains in a corrective environment despite the recent recovery from support. The primary focus is now on the resistance zone between 1.18655 and 1.19191. A bearish rejection from this area could complete wave (b) and trigger wave (c) toward the Fibonacci 423.6 extension target near 1.1120.
Traders should monitor price behaviour closely within the resistance zone, as failure to break above it would reinforce the bearish correction scenario.


US Oil remains under strong bearish pressure after completing a major impulsive decline. Although selling momentum continues to dominate the higher timeframe, the current...

Introduction US Oil remains under strong bearish pressure after breaking below several key support levels. The recent decline has formed a clear impulsive structure, sugg...


