Important Note!
We use cookies to ensure you get the best experience on our website.
By clicking ‘Agree,’ you accept our use of cookies as outlined in our cookies policy

GBPJPY remains in a broader bullish Elliott Wave structure, but the latest price action suggests that the pair may be entering a corrective phase before the next major upward move.
The current structure indicates that Wave 3 may have reached completion, while price is potentially developing Wave 4 as a corrective pullback.
At the same time, the formation around the recent high resembles a Head and Shoulders pattern, providing additional technical support for the expected correction.
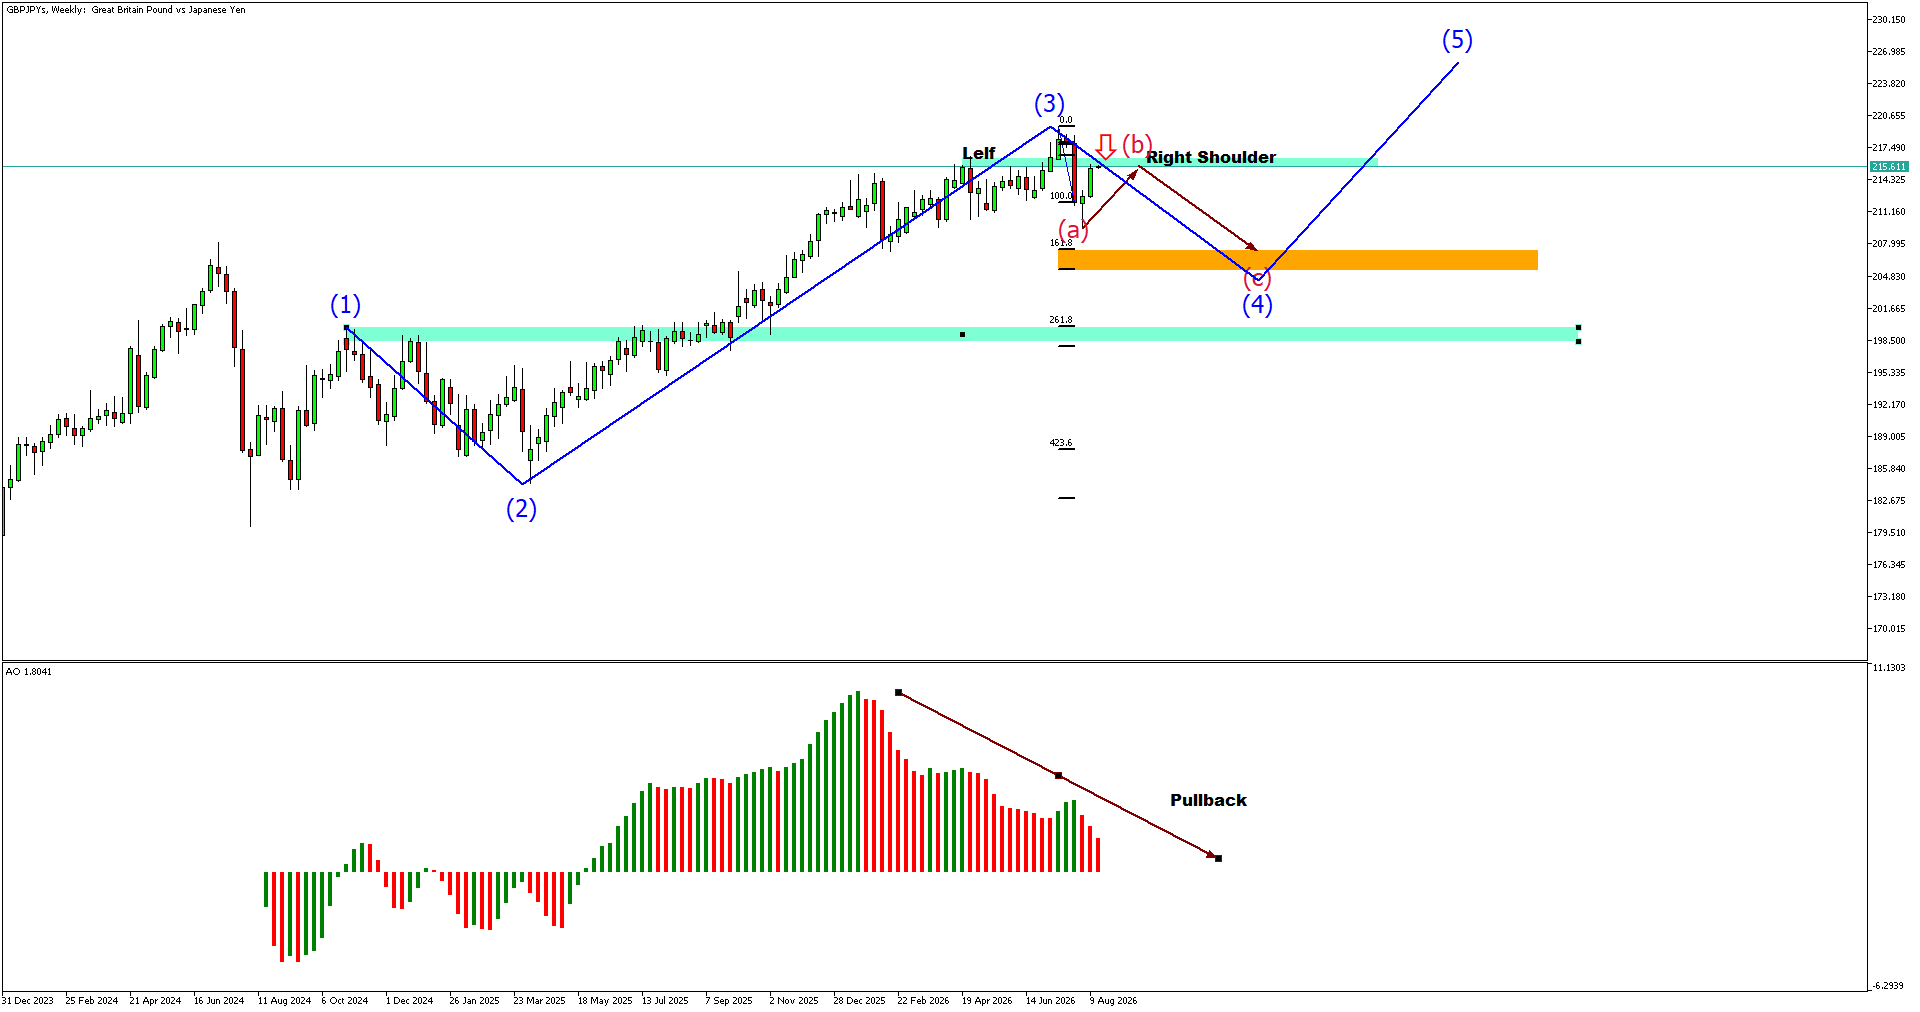
The weekly chart shows a strong impulsive advance from the completion of Wave 2 toward the current high labelled as Wave 3.
However, momentum has started to weaken. The Awesome Oscillator shows declining bullish momentum, with the histogram gradually moving lower from its previous peak.
This weakening momentum suggests that the market may require a deeper correction before the larger bullish trend resumes.
The projected Wave 4 appears to be developing as an ABC corrective structure.
The expected path is:
Wave A → Wave B → Wave C → Wave 4 completion
The highlighted orange zone around the 205.00–207.00 area represents the main projected Wave 4 support zone.
A move into this area would provide a potential location for Wave 4 to complete before the next bullish impulse begins.
The price structure near the recent high also resembles a Head and Shoulders formation.
The chart identifies:
The current formation suggests that the Right Shoulder could develop before another downward movement toward the projected Wave 4 support zone.
A rejection from the Right Shoulder area would strengthen the bearish pullback scenario.
However, the Head and Shoulders pattern should be treated as confirmation rather than the primary basis of the analysis. The Elliott Wave structure remains the main framework.
If GBPJPY reaches the projected Wave 4 zone and finds strong support, the next major move could be Wave 5.
The projected Wave 5 target is around the 222.00–227.00 region.
This means the expected market structure is:
Wave 3 completed → Wave 4 correction → Wave 5 advance
Therefore, the anticipated decline should not necessarily be interpreted as the end of the long-term bullish trend.
Instead, it could represent a normal corrective phase before the final impulsive leg of the current Elliott Wave sequence.
The Awesome Oscillator confirms that bullish momentum has been losing strength.
The histogram has declined from its previous peak, creating a clear momentum pullback while price remains close to its highs.
This divergence between price strength and momentum is an important warning that the current advance may be losing momentum.
If the AO continues to weaken while price develops the Right Shoulder structure, the probability of a Wave 4 correction would increase.
GBPJPY remains structurally bullish on the weekly timeframe, but the current Elliott Wave count suggests that Wave 3 may have completed and Wave 4 could be developing.
The 205.00–207.00 zone is the key area to monitor for a potential Wave 4 completion.
If price reaches this zone and produces a strong bullish reversal, GBPJPY could begin Wave 5 with a projected target around 222.00–227.00.
The key message is:
Pullback first, then potentially Wave 5 higher


The XAUUSD H4 chart is showing an interesting potential bullish reversal structure after a significant decline from the 4,650–4,690 region toward the 4,080–4,085 area....

If you are deciding between CFD and forex trading, understanding the differences between the two is an important first step.


Get the FXGT App


