Important Note!
We use cookies to ensure you get the best experience on our website.
By clicking ‘Agree,’ you accept our use of cookies as outlined in our cookies policy

The EURUSD H4 chart continues to show a potentially constructive Elliott Wave structure following the strong recovery from the Wave (II) low. Price has already established a significant upward sequence and is now undergoing a corrective phase that appears to be developing as Wave (IV).
Based on the current chart structure, the correction is labelled as an A-B-C pattern, with Wave (A) already completed, followed by a corrective Wave (B), while Wave (C) is currently approaching an important support and Fibonacci zone.
The key area to monitor is the Wave (IV) support zone around 1.1470–1.1510. If this zone successfully holds and price produces a bullish reaction, the correction could be considered close to completion. This would open the possibility for the next impulsive advance, labelled Wave (V), toward the higher Fibonacci target area.
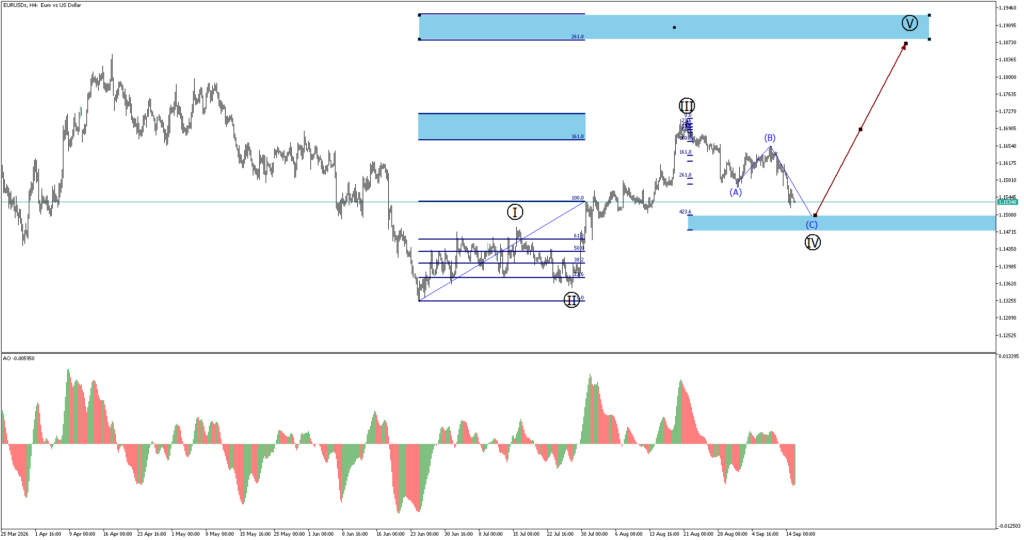
The overall structure therefore remains cautiously bullish from the larger Elliott Wave perspective, but confirmation of the Wave (IV) low is still required before expecting a sustained move higher.
Wave (III) Appears to Have Completed
The previous major advance from the Wave (II) low developed into a strong upward movement and reached the area marked as Wave (III) on the chart.
This advance was significant because price moved progressively higher and eventually reached the upper resistance region before entering a corrective phase.
Once Wave (III) was completed, the market began forming a corrective structure. The current decline is therefore being monitored as a potential Wave (IV) correction rather than an immediate reversal of the larger bullish trend.
Wave (IV) Developing as an A-B-C Correction
The current corrective structure is labelled:
The chart suggests that Wave (B) has already formed a lower high relative to the previous major peak. Price subsequently resumed the decline, supporting the possibility that the market is now developing the final leg of the correction, namely Wave (C).
If this interpretation remains valid, Wave (C) should eventually terminate within or around the highlighted Wave (IV) support area.
Wave (IV) Support Around 1.1470–1.1510
The most important area on the chart is the blue support zone around 1.1470–1.1510.
This area is significant because it coincides with the projected Fibonacci structure and the expected termination region for Wave (C).
A successful reaction from this zone would strengthen the Elliott Wave interpretation that Wave (IV) is approaching completion.
However, traders should avoid assuming that the low is confirmed simply because price enters the zone. A bullish rejection, impulsive recovery or break above nearby resistance would provide stronger confirmation.
If EURUSD breaks decisively below the current Wave (IV) support zone, the bullish count would need to be reassessed.
A deeper correction could indicate that Wave (IV) is not yet complete or that the current wave interpretation requires adjustment. Therefore, the highlighted support should be treated as a watch zone, rather than an unconditional buy area.
First Objective: 1.1660–1.1730 Area
If Wave (C) completes successfully and EURUSD begins a new impulsive advance, the first major area to monitor is approximately 1.1660–1.1730.
This region corresponds with the intermediate Fibonacci projection shown on the chart.
Price may encounter temporary resistance here, particularly if the initial Wave (i) and Wave (ii) structure begins developing inside the larger Wave (V).
A breakout through this region would improve the probability of continuation toward the higher target.
The larger projected target is located around 1.1880–1.1940, where the chart identifies the 261.8 Fibonacci extension.
This area represents the main upside objective for the proposed Wave (V) scenario.
If price successfully completes Wave (IV) and subsequently develops a five-wave impulsive structure higher, this region becomes an important target to monitor.
The projected path therefore suggests:
Wave (C) decline → Wave (IV) support → bullish reversal → Wave (V) advance → 1.1880–1.1940 target zone.
For the bullish scenario to gain stronger confirmation, EURUSD should first show evidence that selling pressure is weakening around the Wave (IV) support zone.
Important signs would include:
A combination of these signals would provide greater confidence that Wave (C) has completed.
The main risk to the bullish outlook is a decisive breakdown through the projected Wave (IV) support.
If price breaks and holds below the support zone, the expected Wave (V) scenario may be delayed or invalidated.
Therefore, the support zone should remain the primary level for determining whether the current correction is ending or whether EURUSD requires a deeper retracement.
The Awesome Oscillator also provides an important confirmation element.
The recent AO movement has weakened toward the negative side as price declined into the current corrective phase. This is consistent with the idea that EURUSD is still experiencing corrective momentum rather than being in a confirmed new bullish impulse.
However, if AO begins recovering strongly from the negative region while price holds the Wave (IV) support zone, this could provide additional evidence that downside momentum is fading.
A bullish momentum recovery combined with a successful support reaction would strengthen the possibility of a new Wave (V) advance.
The preferred scenario based on the current Elliott Wave structure is:
EURUSD completes Wave (C) → Wave (IV) finds support around 1.1470–1.1510 → bullish reversal develops → price breaks higher → Wave (V) advances toward 1.1660–1.1730 → continuation toward the 1.1880–1.1940 Fibonacci target zone.
The key is to wait for confirmation that Wave (C) has actually completed rather than anticipating the bottom too early.
If EURUSD fails to hold the highlighted Wave (IV) support and continues declining, the current Elliott Wave count would require reassessment.
A sustained breakdown below the support zone would suggest that the corrective structure may be deeper or more complex than currently projected.
EURUSD H4 is currently at an important technical stage. The larger structure remains potentially bullish, while the market appears to be completing a corrective Wave (IV) through an A-B-C pattern.
The most important area to watch is the 1.1470–1.1510 support zone, which is expected to provide potential termination for Wave (C).
If this zone holds and bullish confirmation appears, the next major move could develop as Wave (V), with an intermediate objective around 1.1660–1.1730 and a larger Fibonacci 261.8 target around 1.1880–1.1940.
Key outlook: Wave (C) approaches support → Wave (IV) potentially completes → bullish reversal → Wave (V) continuation toward the 261.8 Fibonacci target.


The XAUUSD H4 chart is showing an interesting potential bullish reversal structure after a significant decline from the 4,650–4,690 region toward the 4,080–4,085 area....

If you are deciding between CFD and forex trading, understanding the differences between the two is an important first step.


Get the FXGT App


