Important Note!
We use cookies to ensure you get the best experience on our website.
By clicking ‘Agree,’ you accept our use of cookies as outlined in our cookies policy

The Dow Jones Industrial Average (US30) continues to trade within a strong bullish trend after completing a powerful impulsive rally. However, the latest price structure suggests that the market is approaching the final stage of its current impulse, where profit-taking and a corrective pullback become increasingly likely.
Using Elliott Wave, Fibonacci extensions, and momentum analysis, the preferred scenario is for a temporary ABC correction before the primary uptrend resumes.
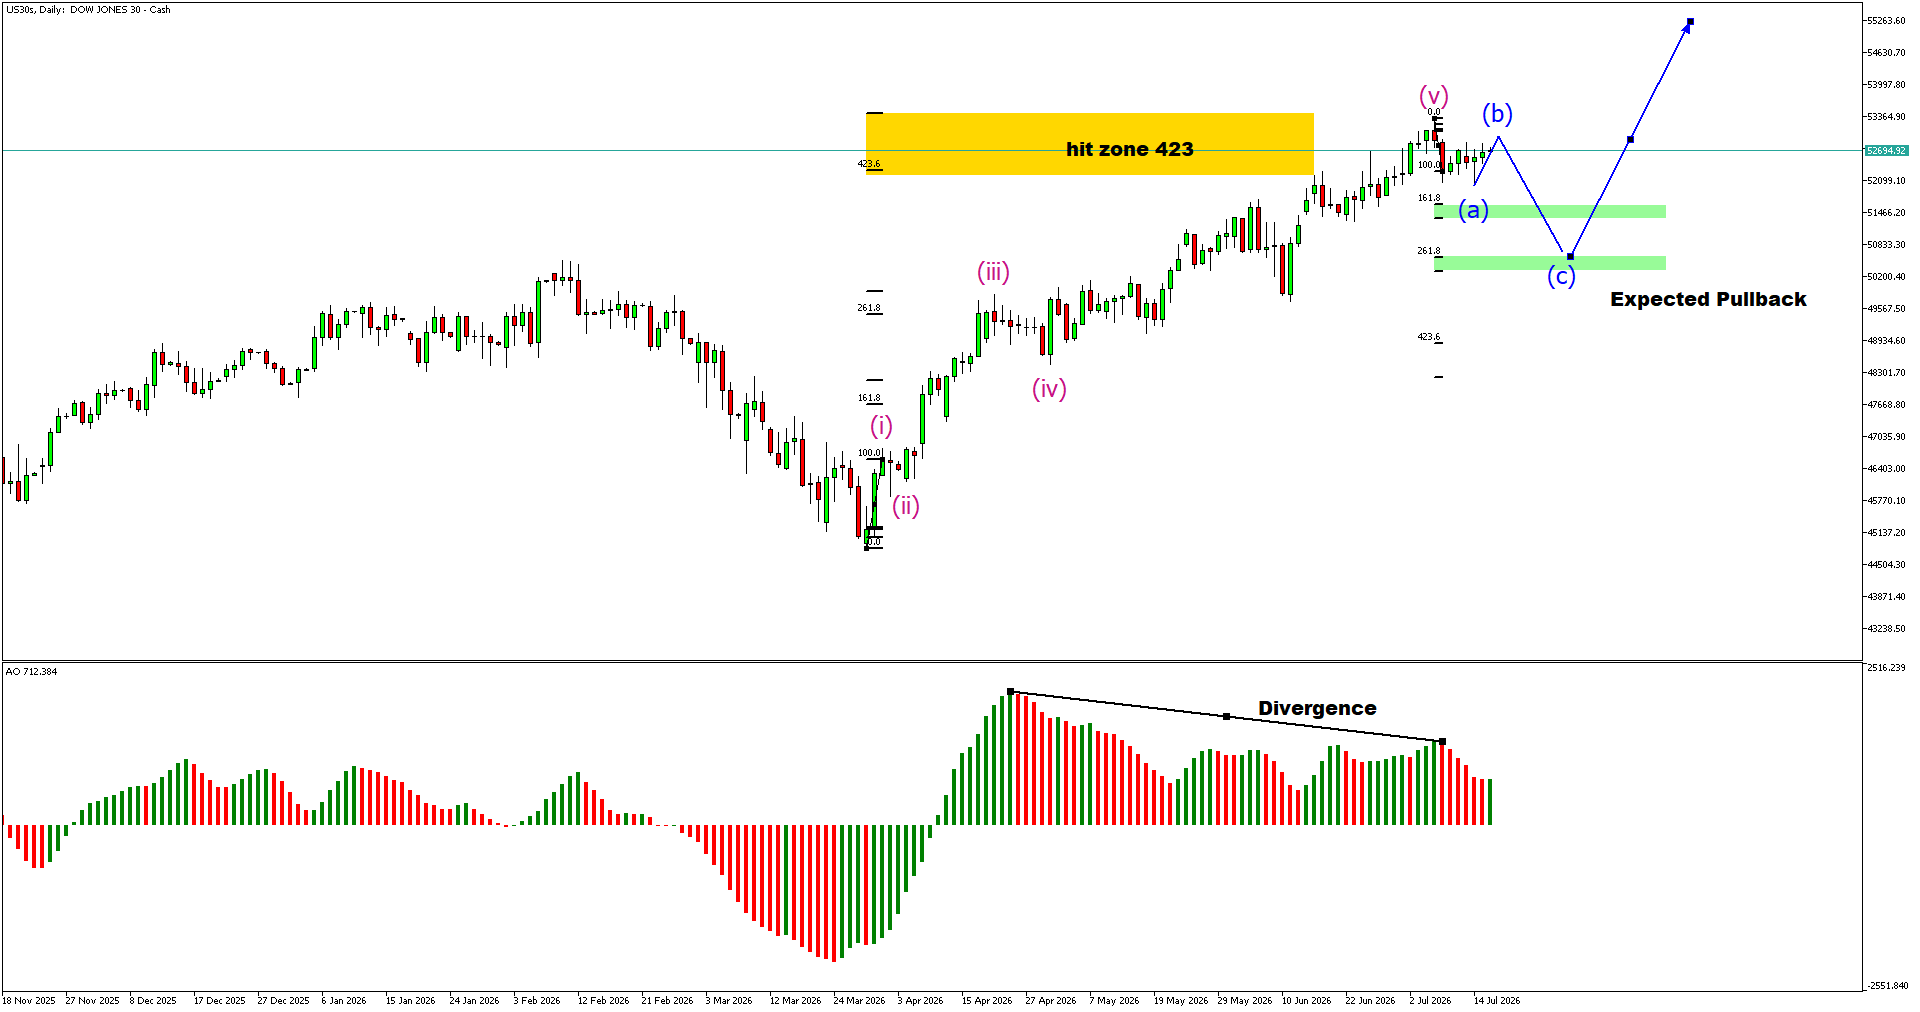
The current advance appears to represent the completion of Wave (v) within a larger impulsive sequence.
Price has already reached the Fibonacci 423.6 extension, highlighted as the major resistance zone. Historically, this extension often acts as an exhaustion level where buying momentum begins to weaken.
As long as price remains within this resistance area, traders should anticipate increased volatility and the possibility of a corrective phase.
The Awesome Oscillator is displaying a bearish divergence, where price continues making higher highs while momentum fails to confirm the new highs.
This divergence suggests that buying pressure is gradually fading despite the ongoing rally.
Although divergence alone does not signal an immediate reversal, it often serves as an early warning that the current impulsive move is approaching completion.
Following the completion of Wave (v), the market is expected to develop a standard ABC corrective pattern.
The anticipated sequence is:
This correction would be considered a healthy retracement within the broader bullish trend rather than a complete trend reversal.
Despite the expected short-term pullback, the higher-timeframe structure remains constructive.
Once the ABC correction is completed and bullish confirmation appears around the projected support zones, the broader Elliott Wave outlook favors another impulsive advance capable of producing fresh all-time highs.
Traders should therefore distinguish between a temporary correction and a genuine change in trend.
US30 remains in a strong long-term uptrend, but the current Elliott Wave structure indicates that the bullish impulse is nearing completion around the Fibonacci 423.6 resistance zone.
The bearish divergence on the Awesome Oscillator strengthens the probability of a short-term ABC correction. If the projected support zones hold, the pullback may provide a higher-probability opportunity for trend-following buyers before the next bullish leg begins.


The XAUUSD H4 chart is showing an interesting potential bullish reversal structure after a significant decline from the 4,650–4,690 region toward the 4,080–4,085 area....

If you are deciding between CFD and forex trading, understanding the differences between the two is an important first step.


Get the FXGT App


