Important Note!
We use cookies to ensure you get the best experience on our website.
By clicking ‘Agree,’ you accept our use of cookies as outlined in our cookies policy

US Oil remains under strong bearish pressure after completing a major impulsive decline. Although selling momentum continues to dominate the higher timeframe, the current structure suggests that price may first develop a corrective recovery before resuming its broader downtrend.
The combination of Elliott Wave analysis, Fibonacci projection, and momentum divergence indicates that traders should monitor the current rebound carefully, particularly as price approaches a major resistance zone.
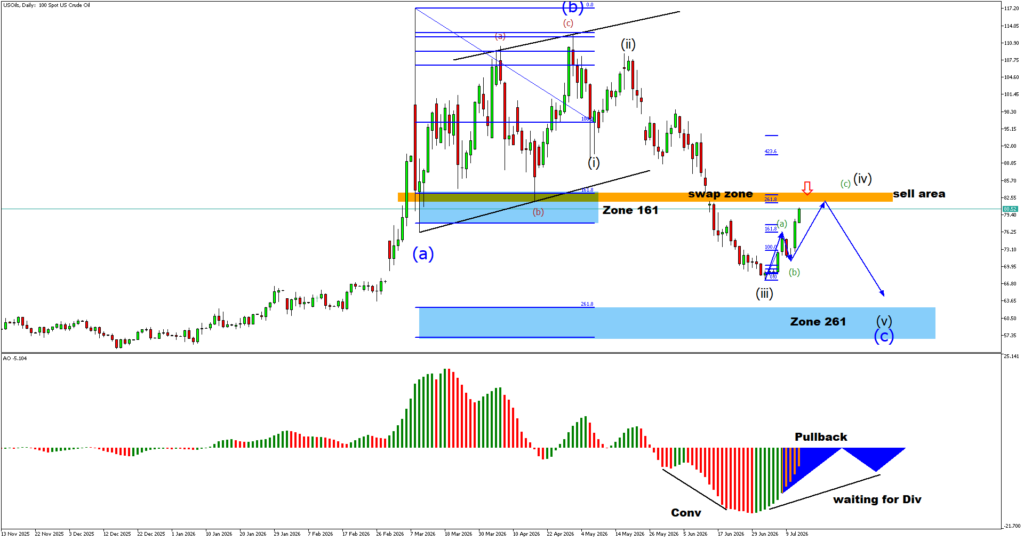
The daily chart suggests that Wave (iii) has likely completed near the recent swing low. From this area, price appears to be developing an ABC corrective structure.
Wave (a) has already formed, while Wave (b) is expected to produce a temporary pullback before Wave (c) pushes higher toward the major resistance zone.
This corrective movement is considered a counter-trend rally rather than the beginning of a new bullish trend.
The primary resistance is located around the Swap Zone / Fibonacci 261.8 extension, which also coincides with previous support that has now turned into resistance.
This confluence creates a high-probability selling area where institutional supply could re-enter the market.
Should price reach this resistance and display bearish rejection signals, the probability of a larger Wave (v) decline increases significantly.
The Awesome Oscillator continues to display improving momentum after an extended bearish phase.
At the same time, bullish convergence is visible on momentum, suggesting that the current recovery still has room to extend before sellers regain control.
However, traders should remember that improving momentum during a correction does not necessarily invalidate the broader bearish market structure.
As long as US Oil remains below the highlighted resistance zone, the overall outlook remains bearish.
The preferred scenario is:
A decisive breakout above the resistance zone would invalidate this bearish wave count and require a reassessment of the current market structure.
US Oil is showing signs of a short-term corrective recovery following an extended decline. Nevertheless, the larger Elliott Wave structure still favors additional downside once the corrective ABC pattern is complete.
Traders should monitor price action closely as it approaches the highlighted resistance zone, where the next high-probability selling opportunity may emerge before the broader bearish trend resumes.


Global financial markets experienced a volatile week as investors reacted to major economic reports, corporate earnings, and ongoing economic uncertainty.


The week of October 19–23, 2026, brings several high-impact economic events that could influence global financial markets.

Get the FXGT App


