Important Note!
We use cookies to ensure you get the best experience on our website.
By clicking ‘Agree,’ you accept our use of cookies as outlined in our cookies policy

US30 continues to show a bullish Elliott Wave structure on the H4 timeframe. The current price action suggests that Wave 2 correction may have completed or is very close to completion, with price reacting from the highlighted Fibonacci support zone.
If this structure remains valid, the next major movement could be the beginning of Wave 3, which has the potential to push US30 toward the 56,000–56,600 area.
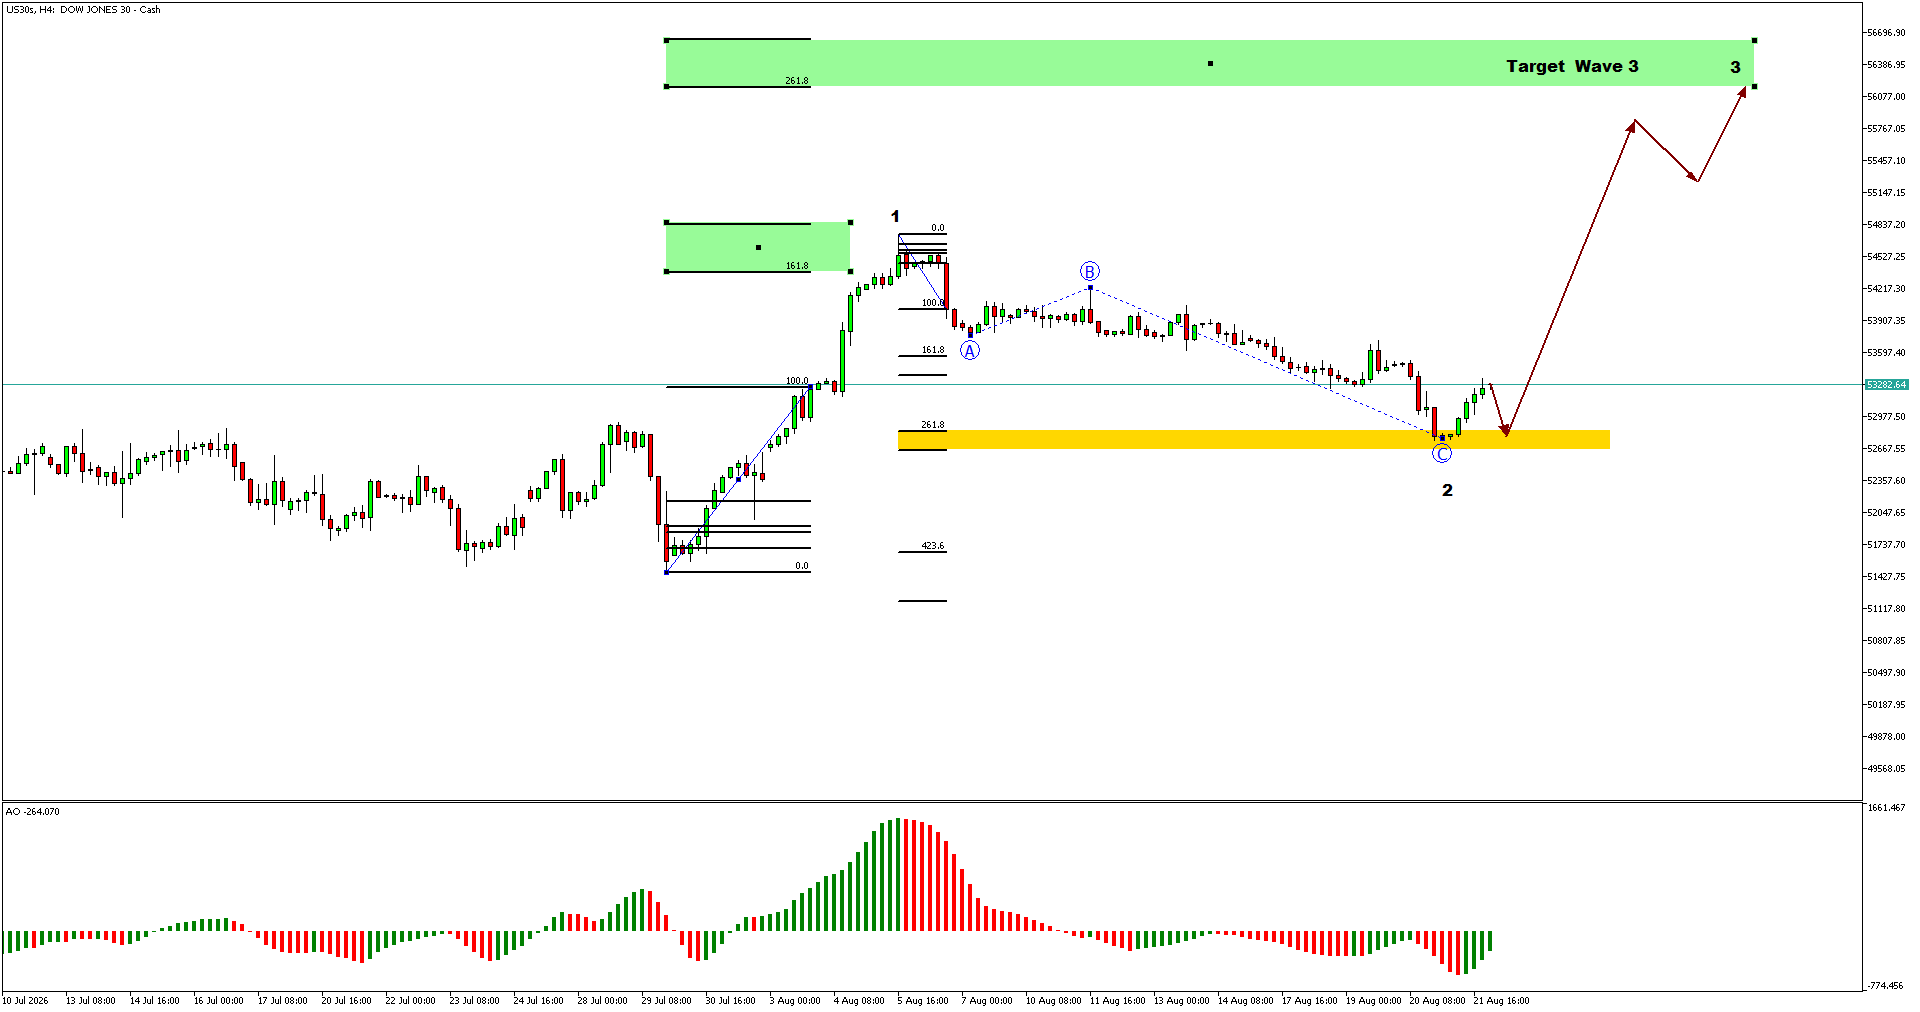
The chart shows a completed Wave 1 followed by an ABC corrective structure, forming the expected Wave 2 correction.
Price has reached the highlighted 261.8% Fibonacci zone around 52,600–52,800, which is acting as an important support area. The reaction from this zone strengthens the possibility that Wave 2 has found its low.
The projected structure indicates an initial bullish move followed by a minor pullback before another stronger advance. This would be consistent with the early stages of a larger Wave 3.
The major upside target is located around 56,000–56,600, represented by the green Fibonacci extension zone. A sustained breakout above the recent resistance would provide stronger confirmation that Wave 3 is developing.
From the Elliott Wave perspective, the key level to monitor remains the Wave 2 low/support zone. As long as this area holds, the bullish Wave 3 scenario remains favoured.
US30 H4 is showing a potential Wave 2 completion, with price reacting from the 261.8% Fibonacci support zone. The immediate structure suggests further upside, while the larger Elliott Wave projection points toward 56,000–56,600 as the next major target.
Key focus: Hold above the Wave 2 low → bullish Wave 3 confirmation → target 56,000–56,600.
Invalidation: A decisive break below the Wave 2 low would weaken or invalidate the current bullish Elliott Wave count.


The XAUUSD H4 chart is showing an interesting potential bullish reversal structure after a significant decline from the 4,650–4,690 region toward the 4,080–4,085 area....

The AUDUSD weekly chart continues to show an interesting bullish Elliott Wave structure following the strong recovery from the previous major low.

Get the FXGT App


