Important Note!
We use cookies to ensure you get the best experience on our website.
By clicking ‘Agree,’ you accept our use of cookies as outlined in our cookies policy

USD/CAD is showing signs of a potential bearish reversal after completing a corrective structure on the daily timeframe. The latest price action failed to sustain its bullish momentum after reaching a major resistance area and performing a liquidity sweep above the previous high.
Based on the Elliott Wave structure, this movement may signal the beginning of a new bearish phase, with Wave 1 expected to move toward the lower Fibonacci target zone before a potential Wave 2 corrective rebound.
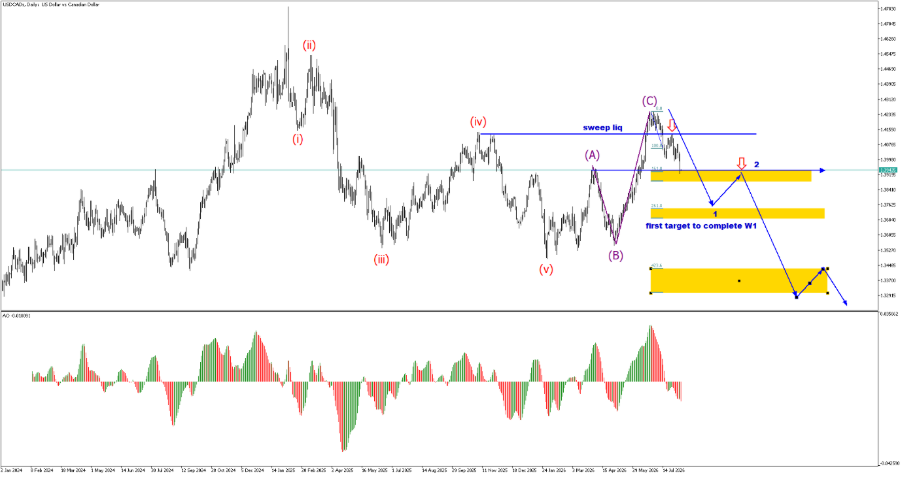
The previous structure shows a five-wave bearish sequence, labelled Wave (i) through Wave (v), followed by an ABC corrective structure.
Wave (A) moved higher from the low, followed by Wave (B) to the downside. Wave (C) then advanced strongly and reached a major resistance area.
However, price subsequently rejected the resistance after performing a liquidity sweep above the previous high.
This development suggests that the ABC corrective structure may have been completed and that the market could now be entering a new bearish phase.
The area marked “sweep liq” represents an important technical zone in the current analysis.
Price moved above the previous high before reversing lower. From a price action perspective, this liquidity sweep may indicate that buy-side liquidity above the previous high was taken before sellers regained control.
As long as price fails to sustain a breakout above the liquidity sweep area, the bearish scenario remains the preferred outlook.
Following the completion of Wave (C), the current projection suggests the development of Wave 1 to the downside.
The first target is located within the highlighted Fibonacci zone. This area may provide temporary support before the market develops a corrective Wave 2 rebound.
Once Wave 1 is completed, Wave 2 is expected to retrace higher toward the previous resistance area. This pullback will be important because it may provide an opportunity to confirm whether the broader bearish structure is developing.
If Wave 2 fails to break above the key resistance area, the bearish structure would gain further confirmation.
After Wave 2 is completed, the Elliott Wave projection suggests the potential development of a stronger Wave 3 decline.
The next major target is located around the 423.6% Fibonacci extension zone, highlighted on the chart.
This area represents an important potential support zone and may become a key level for monitoring price behaviour as the bearish structure develops.
Traders should distinguish between a corrective Wave 2 pullback and an actual trend reversal. As long as price continues to form lower highs following Wave 1, downside pressure remains dominant.
The Awesome Oscillator also provides an important indication of the potential momentum shift.
After bullish momentum strengthened during the development of Wave (C), the AO histogram has started to lose bullish momentum and move toward negative territory.
This change suggests that the previous bullish move is losing strength.
However, additional confirmation is still required through price action and the development of a clear lower-high and lower-low structure before confirming that Wave 1 has fully begun.
The preferred scenario for USD/CAD remains bearish.
Price is expected to continue lower toward the first Fibonacci target zone to complete Wave 1, followed by a potential Wave 2 corrective rebound before another larger decline develops.
Traders should monitor:
A sustained breakout and close above the liquidity sweep and major resistance area would require the current bearish Elliott Wave count to be reassessed, as it could indicate that the larger bullish correction is not yet complete.
USD/CAD is showing signs of a potential bearish reversal after completing the ABC corrective structure and performing a liquidity sweep above the previous high.
The current Elliott Wave projection suggests that Wave 1 could move toward the first Fibonacci target zone, followed by a corrective Wave 2 rebound before the market resumes a larger downward movement.
As long as price remains below the key resistance and liquidity sweep area, the preferred bias remains bearish, with the next major downside objective potentially located around the 423.6% Fibonacci extension zone.
Traders should wait for confirmation from price action and momentum before entering positions to avoid premature entries.


The XAUUSD H4 chart is showing an interesting potential bullish reversal structure after a significant decline from the 4,650–4,690 region toward the 4,080–4,085 area....

If you are deciding between CFD and forex trading, understanding the differences between the two is an important first step.


Get the FXGT App


