Important Note!
We use cookies to ensure you get the best experience on our website.
By clicking ‘Agree,’ you accept our use of cookies as outlined in our cookies policy

Gold (XAUUSD) continues to maintain a strong bullish structure on the H4 timeframe, with the latest price action indicating that Subwave (iii) may have reached completion.
The current movement suggests that Gold is entering a corrective Subwave (iv) before potentially developing the final Subwave (v) higher. The Elliott Wave structure, Fibonacci projections and current momentum continue to support the possibility of another bullish leg toward the major target zone.
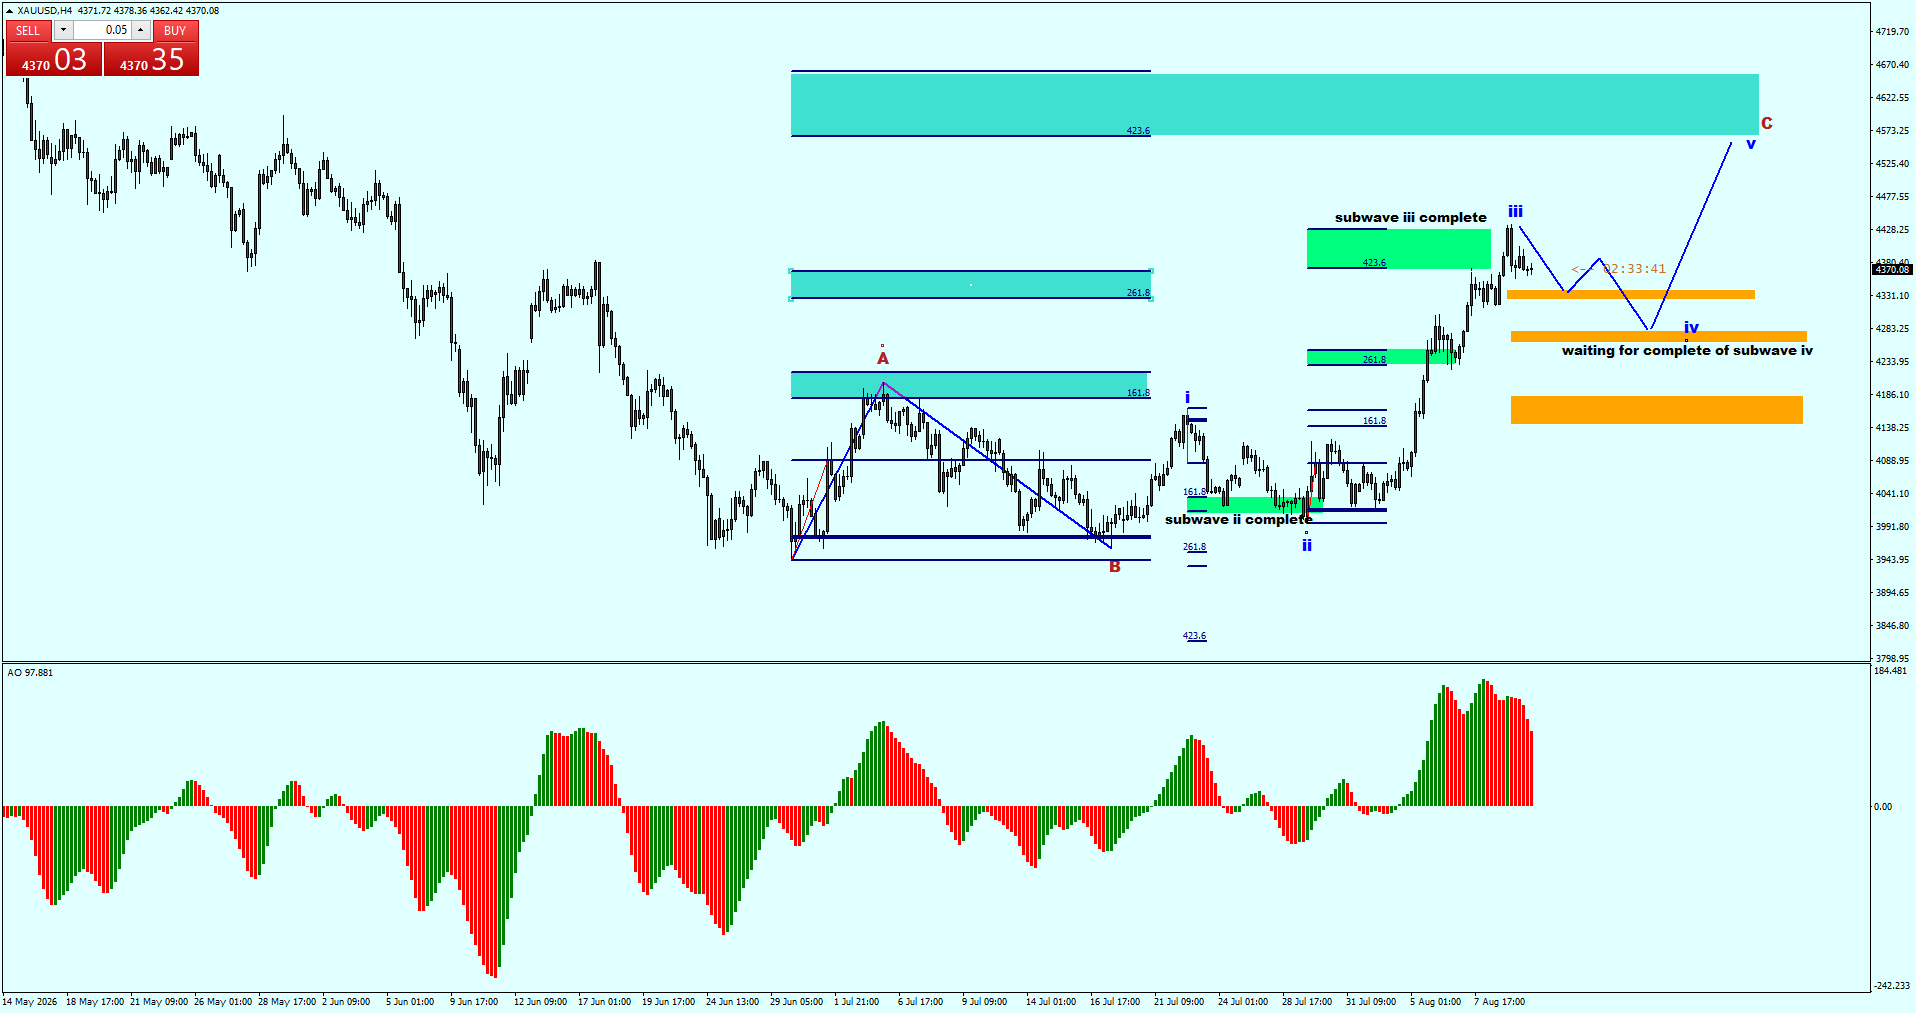
The recent rally from the previous corrective low has developed into a strong impulsive advance.
The chart indicates that Subwave (iii) has reached the highlighted Fibonacci extension area, where price has started to consolidate and lose some short-term momentum.
This behaviour is consistent with a potential completion of Subwave (iii), particularly after the strong bullish expansion seen over the previous sessions.
The current consolidation should therefore be monitored closely for the development of Subwave (iv).
Following the completion of Subwave (iii), Gold is expected to undergo a corrective pullback in Subwave (iv).
The projected path suggests that the correction could move toward one of the highlighted orange support zones before the next bullish move begins.
The correction does not necessarily indicate a trend reversal. Instead, it may represent a normal pause within the larger bullish Elliott Wave structure.
As long as the projected support areas hold, the bullish wave count remains valid.
After Subwave (iv) is completed, the chart projects another bullish move in Subwave (v).
This final impulsive leg could potentially complete the larger Wave C structure.
The projected target area is located within the highlighted upper Fibonacci zone, approximately around 4,573–4,622.
This area is therefore an important resistance and potential completion zone for the current bullish structure.
A successful move toward this region would complete the projected Wave C and potentially mark an important turning point for the larger market structure.
Fibonacci projections provide additional confluence to the current Elliott Wave scenario.
The upper target zone coincides with the 423.6% Fibonacci extension, making it an important area to monitor for potential exhaustion.
The combination of:
creates a strong technical confluence around the projected target zone.
Traders should therefore avoid chasing aggressively into this area and instead monitor price action for signs of exhaustion or reversal.
The Awesome Oscillator (AO) remains strongly positive on the H4 timeframe.
The recent bullish expansion in the histogram confirms that upside momentum has increased significantly during the development of Subwave (iii).
However, the histogram has started to show some moderation from its recent peak. If the momentum continues to weaken while price remains near the highs, this could provide an early warning that Subwave (iii) is complete and Subwave (iv) is developing.
A deeper correction in the AO would be consistent with the expected Wave (iv) pullback.
The preferred scenario remains bullish, but traders should expect a corrective phase before the next potential advance.
The projected structure is:
Subwave (iii) completed → Subwave (iv) correction → Subwave (v) advance → Wave C completion.
The orange support zones on the chart should be monitored during the expected Subwave (iv) correction.
A bullish reaction from these areas would strengthen the probability of Subwave (v) developing toward the upper Fibonacci target zone.
Traders should look for:
Conversely, a sustained break below the major corrective support zones would weaken the current bullish Elliott Wave count and require the structure to be reassessed.
XAUUSD remains technically bullish on the H4 timeframe, with Subwave (iii) appearing to have completed following the latest strong advance.
The market is now expected to develop Subwave (iv) as a corrective phase before potentially beginning Subwave (v) toward the projected Wave C completion zone.
The major upside target is located around the 4,573–4,622 region, supported by the 423.6% Fibonacci extension.
For now, the key focus is the expected Subwave (iv) correction. If Gold finds support within the projected correction zones and bullish momentum returns, the final Subwave (v) could provide another significant move higher toward the projected Wave C target.


The XAUUSD H4 chart is showing an interesting potential bullish reversal structure after a significant decline from the 4,650–4,690 region toward the 4,080–4,085 area....

If you are deciding between CFD and forex trading, understanding the differences between the two is an important first step.


Get the FXGT App


