Important Note!
We use cookies to ensure you get the best experience on our website.
By clicking ‘Agree,’ you accept our use of cookies as outlined in our cookies policy

Bitcoin remains under significant selling pressure after breaking below key support levels on the H4 timeframe. The current price structure suggests that the market may be developing a larger bearish Elliott Wave sequence, with further downside expected before a meaningful recovery can occur.
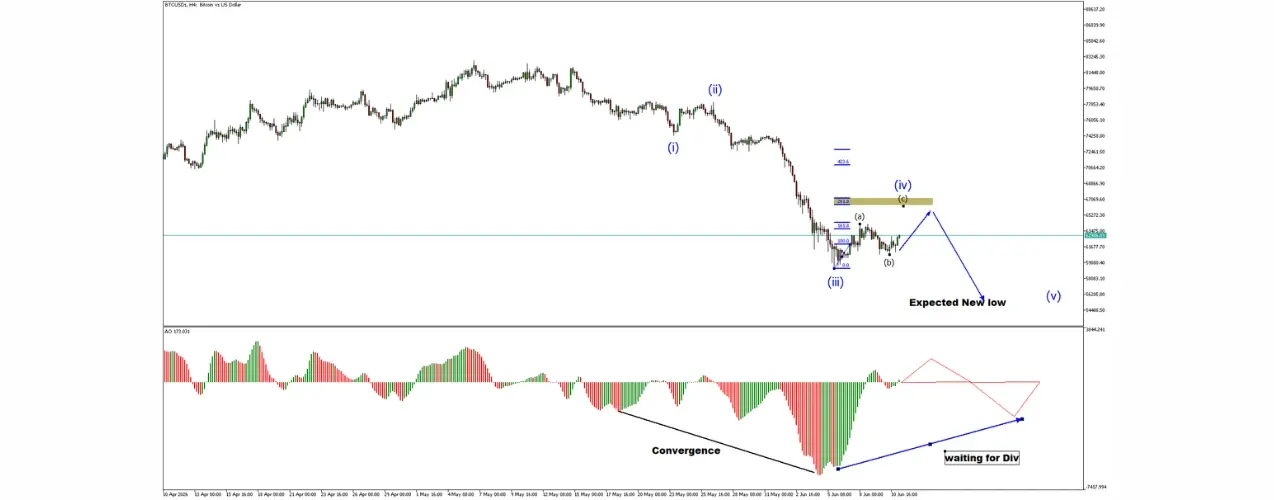
The overall trend remains bearish as Bitcoin continues to form a sequence of lower highs and lower lows. The strong decline from the recent swing high indicates that sellers remain in control of the market.
The current wave structure suggests that waves (i) and (ii) have already been completed, while wave (iii) produced a strong impulsive decline. Price is currently attempting a corrective recovery that may form wave (iv) before another decline develops.
A corrective rally towards the Fibonacci resistance zone remains possible before sellers return to the market.
From an Elliott Wave perspective, Bitcoin appears to be developing a five-wave bearish sequence.
The projected path suggests that Bitcoin may attempt a short-term recovery before resuming its broader bearish trend.
The oscillator at the bottom of the chart is showing signs of convergence. Although this may support a temporary rebound, there is currently no confirmed bullish divergence.
Traders should monitor the oscillator closely. A confirmed bullish divergence would increase the probability of a stronger corrective rally. Until then, bearish momentum remains dominant.
The Fibonacci 261.8 extension area around the highlighted resistance zone represents the most important level for wave (iv).
If price reaches this area and shows signs of rejection, sellers may use the zone as an opportunity to re-enter the market.
A failure to break above this resistance would strengthen the bearish continuation scenario.
The preferred scenario remains bearish while price stays below the Fibonacci resistance area.
A corrective rally into resistance could provide selling opportunities before the next impulsive decline begins. If the Elliott Wave count remains valid, Bitcoin may continue lower and establish a new swing low during wave (v).
Bitcoin remains technically bearish on the H4 timeframe. The current price action suggests a corrective recovery may occur before another wave of selling pressure emerges. Traders should watch the Fibonacci resistance zone closely, as rejection from this area could trigger the next leg lower and potentially create new lows in the market.


Gold (XAU/USD) continues to trade within a bullish medium-term structure despite the recent pullback from its latest swing high.

Gold (XAUUSD) has staged a strong rebound after finding support near the lower boundary of the corrective structure.

Get the FXGT App


