Important Note!
We use cookies to ensure you get the best experience on our website.
By clicking ‘Agree,’ you accept our use of cookies as outlined in our cookies policy

Bitcoin (BTCUSD) is showing signs of a potential bullish recovery after completing a larger five-wave decline. The current structure suggests that Wave (5) may have completed near the 60,000–62,000 area, opening the possibility for a corrective ABC recovery.
The latest price movement has also started to show improving momentum, supporting the possibility of further upside.
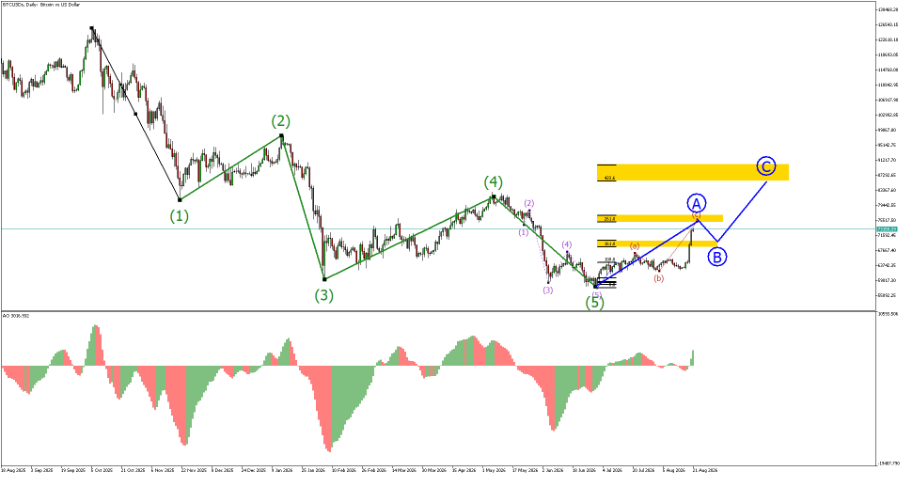
The larger Elliott Wave structure indicates that Bitcoin previously completed Waves (1) through (5) on the downside. Wave (5) appears to have reached the major support area around 60,000–62,000, potentially completing the larger bearish sequence.
Following this low, price began forming a corrective recovery structure labelled Wave A-B-C.
The current projection suggests that Wave A is developing toward the 75,000–78,000 region. After Wave A completes, Bitcoin may experience a temporary Wave B pullback before continuing higher through Wave C.
The Fibonacci projections on the chart highlight several important upside zones.
The first significant target is around 78,000, corresponding to the 261.8 Fibonacci extension area. A successful breakout and continuation above this region would strengthen the bullish ABC recovery scenario.
The larger Wave C target is positioned around 87,000–91,000, where the 423.6 Fibonacci extension zone is located.
This area represents the main projected target for the current corrective recovery.
The preferred scenario is:
Wave (5) completion → Wave A advance → Wave B pullback → Wave C advance.
If Wave B remains above the Wave (5) low and price continues to form higher lows, the structure remains supportive of a larger corrective recovery.
The Awesome Oscillator is also showing an improvement in momentum after the previous strong bearish phase. The latest positive momentum suggests that buying pressure may be returning.
However, confirmation is still required before assuming that the entire corrective structure has turned decisively bullish.
BTCUSD appears to have potentially completed the larger five-wave decline and is now developing a corrective ABC recovery.
The key levels to monitor are:
The 87,000–91,000 zone is the major upside target shown on the chart.
As long as Bitcoin maintains the Wave (5) low and continues forming higher lows, the bullish ABC recovery scenario remains valid. A strong rejection from the Fibonacci zones or a break below the Wave (5) low would invalidate or significantly weaken this bullish projection.


Bitcoin remains in focus as easing interest rate fears help stabilize prices near $82,000, despite continued outflows from Bitcoin ETFs and mixed technical signals


The cryptocurrency market remains in focus as Bitcoin stages a recovery despite significant ETF outflows, security concerns, and growing regulatory scrutiny.

Get the FXGT App


