Important Note!
We use cookies to ensure you get the best experience on our website.
By clicking ‘Agree,’ you accept our use of cookies as outlined in our cookies policy

GBP/JPY continues to maintain its long-term bullish trend after completing the strong impulsive advance into Wave III. Recent price action indicates that the pair has entered a corrective ABC pullback, which is expected to form Wave IV before the next bullish impulse begins.
The Elliott Wave structure, Fibonacci support zone, and Awesome Oscillator momentum suggest that the current correction could provide an opportunity for buyers before the market resumes its primary uptrend.
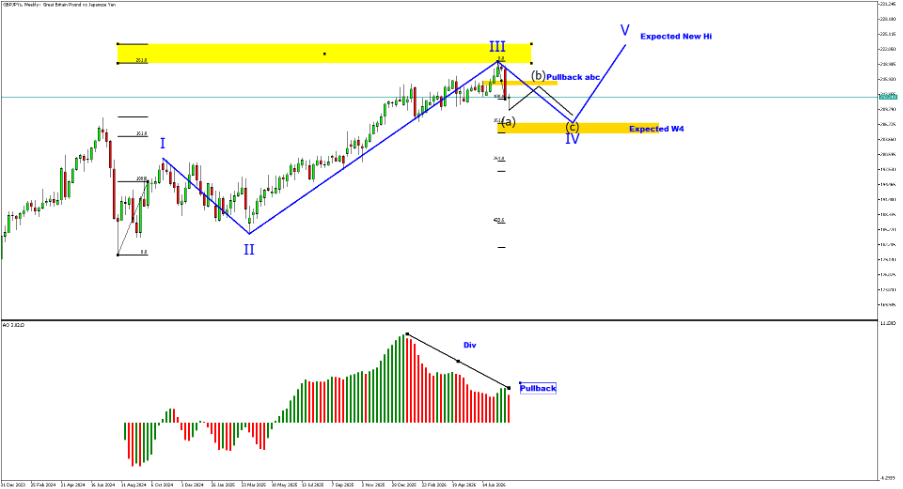
Following the completion of Wave III, GBP/JPY has started an ABC corrective structure.
Wave (A) has already declined from the recent high, while the current recovery is identified as Wave (B). Once Wave (B) is completed, the market is expected to decline into Wave (C), completing the larger Wave IV correction near the highlighted Fibonacci support zone.
This support area is expected to attract fresh buying interest before the next impulsive rally.
Upon completion of Wave IV, GBP/JPY is expected to begin Wave V, extending the long-term bullish trend.
The projected bullish scenario targets:
As long as the support zone remains intact, the broader bullish outlook continues to dominate.
The Awesome Oscillator is displaying a bearish divergence, indicating that bullish momentum weakened as price reached a new high.
The histogram also suggests that the market is currently in a pullback phase, supporting the expectation of a Wave IV correction before bullish momentum returns.
Traders should monitor for bullish momentum recovery near the projected support zone.
The preferred scenario is for GBP/JPY to complete Wave IV near the highlighted Fibonacci support area before resuming its long-term uptrend.
Traders should monitor:
A sustained break below the projected support zone would weaken the current bullish wave count and increase the possibility of a deeper correction.
GBP/JPY remains bullish in the longer-term despite the ongoing correction. The current ABC pullback is viewed as Wave IV, while the broader Elliott Wave structure continues to favour another bullish impulse toward a new all-time high in Wave V. As long as the Fibonacci support zone holds, the probability remains high that buyers will regain control after the correction is completed.


The XAUUSD H4 chart is showing an interesting potential bullish reversal structure after a significant decline from the 4,650–4,690 region toward the 4,080–4,085 area....

If you are deciding between CFD and forex trading, understanding the differences between the two is an important first step.


Get the FXGT App


