Important Note!
We use cookies to ensure you get the best experience on our website.
By clicking ‘Agree,’ you accept our use of cookies as outlined in our cookies policy

Gold prices have come under renewed selling pressure after breaking below a significant support area near 4366. The breakdown confirms a bearish market structure on the H1 timeframe and suggests that sellers remain firmly in control.
Recent price action shows a decisive move below the previous swap zone, transforming former support into potential resistance.
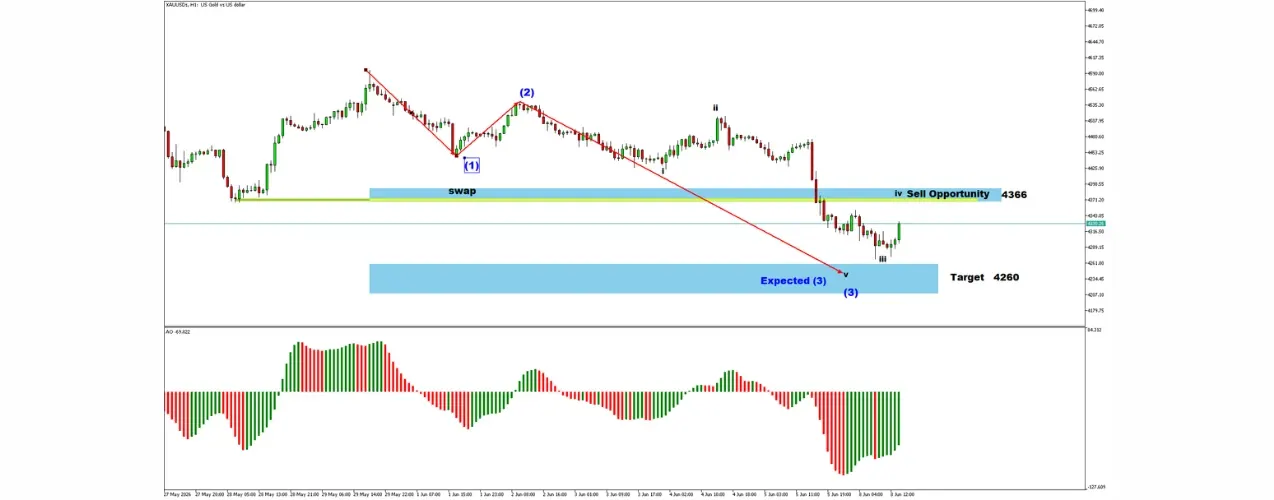
The chart indicates the development of a bearish impulsive wave sequence.
Gold initially completed a corrective rebound, labelled as Wave (2), before sellers regained momentum and pushed prices lower.
The strong decline following the breakdown suggests that Wave (3) may now be in progress. Typically, Wave (3) is the strongest and longest wave within an Elliott Wave impulse structure.
Current market behaviour supports this scenario as bearish momentum continues to accelerate.
The former support zone around 4366 is now acting as a potential resistance area.
If price stages a corrective rebound toward this zone, sellers may look for confirmation of rejection before considering bearish positions.
A successful retest could provide an opportunity for the next leg lower.
Key Resistance
Immediate Support
The Awesome Oscillator (AO) has expanded sharply into negative territory, indicating increasing bearish momentum.
The strength of the negative histogram suggests that selling pressure remains dominant, supporting the continuation of the current downtrend.
Unless momentum begins to weaken significantly, the bearish scenario remains favoured.
Based on the projected Elliott Wave structure, the next downside objective is located near 4260.
This area aligns with a significant support zone and may serve as a potential completion point for the current bearish wave sequence.
A move toward this level would represent the continuation of the prevailing downtrend.
The technical outlook for gold remains bearish while price trades below the 4366 resistance zone. The breakdown from support, combined with strong bearish momentum and an active Elliott Wave structure, suggests that further downside movement remains likely.
Traders should monitor any corrective rallies toward resistance for potential bearish continuation signals. As long as 4366 remains intact, the path of least resistance appears to be lower.
XAUUSD has confirmed a bearish breakdown below a major support area, shifting market sentiment in favour of sellers. The Elliott Wave structure indicates that Wave (3) may be underway, with 4260 serving as the next major downside target. A corrective rally toward 4366 could offer a fresh selling opportunity before the next bearish leg develops.


Gold (XAU/USD) continues to trade within a bullish medium-term structure despite the recent pullback from its latest swing high.

Gold (XAUUSD) has staged a strong rebound after finding support near the lower boundary of the corrective structure.

Get the FXGT App


