Important Note!
We use cookies to ensure you get the best experience on our website.
By clicking ‘Agree,’ you accept our use of cookies as outlined in our cookies policy

US30 remains structurally bullish on the H4 timeframe after breaking above the previous swap area around the 52,900 region.
The breakout triggered a strong impulsive rally toward the 54,500 area. However, momentum has now started to weaken, suggesting that US30 may be entering a corrective phase before attempting another bullish move.
The current Elliott Wave structure points toward an ABC correction, with Wave (c) potentially returning to the previous breakout zone and Fibonacci 261.8% area.
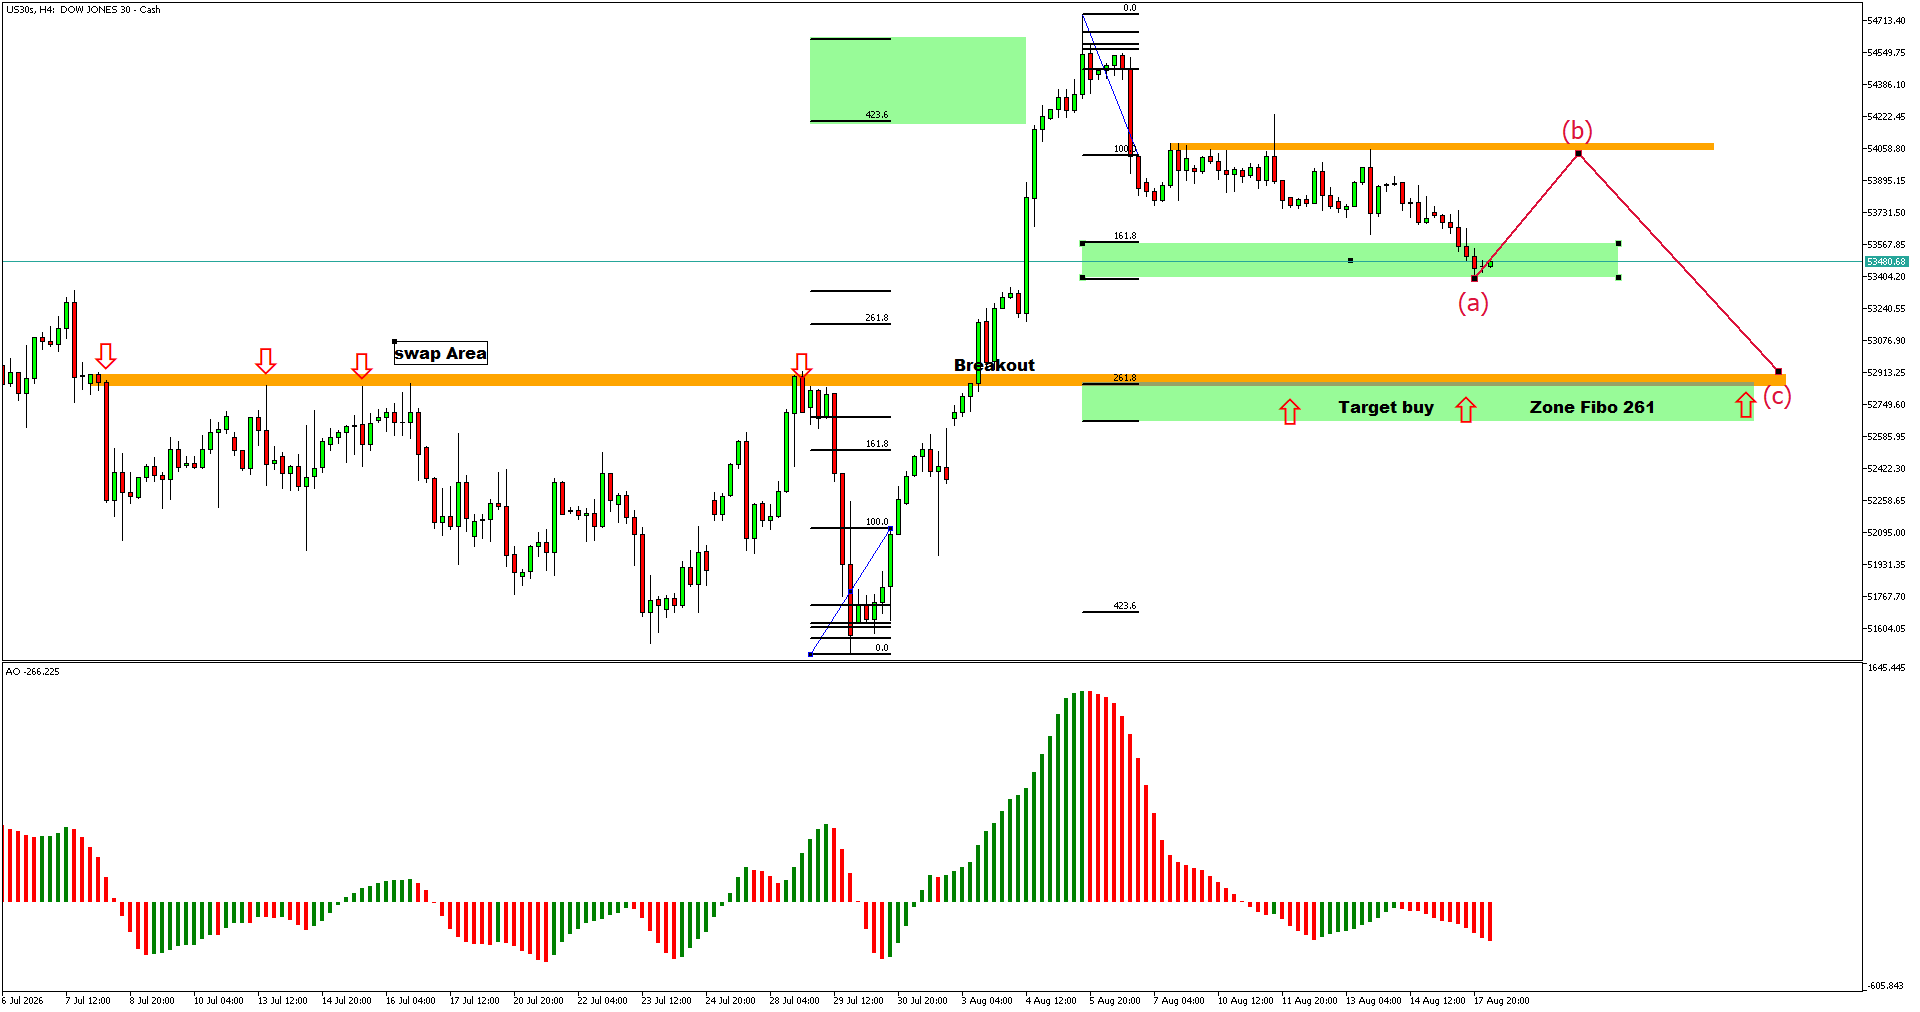
The key development on the chart is the successful breakout above the previous swap area.
This area had previously acted as an important resistance zone, with multiple price reactions around the 52,900 region.
Once price broke above this level, US30 accelerated sharply higher, confirming the strength of the bullish breakout.
The previous resistance area can now potentially act as support if price returns to test it.
After a strong breakout, a retest of the previous resistance is technically normal.
The current structure suggests that US30 may be developing an ABC corrective pattern:
Wave (a) → Wave (b) → Wave (c)
Wave (a) has already moved lower into the highlighted green support zone, while Wave (b) is projected to rebound toward the 54,050 area.
Wave (c) could then complete the correction by moving lower toward the major Fibonacci support zone.
Wave (b) Could Retest the 54,050 Area
The chart projects Wave (b) toward the orange resistance zone around 54,050.
This area could become an important resistance zone during the corrective rebound.
If price reaches this zone but fails to break higher, the next expected move would be Wave (c) to the downside.
Therefore, traders should monitor the reaction around this resistance area for confirmation of the next bearish leg of the correction.
Wave (c) Target: Fibonacci 261.8% Zone
The main target for Wave (c) is the highlighted Fibonacci 261.8% zone around the 52,750–52,950 region.
This area is particularly important because it overlaps with the previous breakout and swap area.
The confluence between:
creates a strong technical support area.
This is the primary zone to monitor for a potential bullish reversal.
The highlighted green zone around the 52,750–52,950 area is the main potential buy zone according to the current chart structure.
If Wave (c) reaches this area and price produces a clear bullish reversal, the correction could be considered complete.
However, traders should wait for confirmation rather than entering solely because price reaches the zone.
Possible confirmation could include:
The Awesome Oscillator confirms that bullish momentum has weakened after the strong rally.
The histogram expanded significantly during the breakout and subsequent rally, but has now contracted and moved toward negative territory.
This indicates that the strong bullish momentum seen during the breakout is fading.
The weakening AO supports the possibility of a corrective phase rather than an immediate continuation higher.
However, momentum weakness alone does not confirm a full bearish trend reversal. The broader structure remains dependent on how price reacts around the projected Wave (c) support zone.
US30 remains bullish from a broader structural perspective after breaking above the previous swap area.
The current price action suggests that the market may be developing an ABC correction, with Wave (b) potentially rebounding toward 54,050 before Wave (c) moves lower.
The key area to watch is the 52,750–52,950 Fibonacci 261.8% and breakout retest zone.
If Wave (c) reaches this area and produces a strong bullish reversal, it could provide an opportunity for US30 to resume its broader bullish movement.
Key scenario: Wave (b) rebound → Wave (c) decline → Fibonacci 261.8% retest → potential bullish reversal.


The XAUUSD H4 chart is showing an interesting potential bullish reversal structure after a significant decline from the 4,650–4,690 region toward the 4,080–4,085 area....

If you are deciding between CFD and forex trading, understanding the differences between the two is an important first step.


Get the FXGT App


