Important Note!
We use cookies to ensure you get the best experience on our website.
By clicking ‘Agree,’ you accept our use of cookies as outlined in our cookies policy

The USDCAD H4 chart is showing an important potential transition from a prolonged corrective decline into a new bullish Elliott Wave structure. Price has already completed a significant downward movement, while the recent recovery suggests that the market may be developing the next impulsive phase to the upside.
The current structure is particularly interesting because price appears to be forming a corrective pullback before potentially accelerating into Wave (iii). If the correction respects the projected Fibonacci support zones, the next upside movement could become considerably stronger.
The key focus now is the 1.3780–1.3830 area, which is marked as the expected pullback zone on the chart.
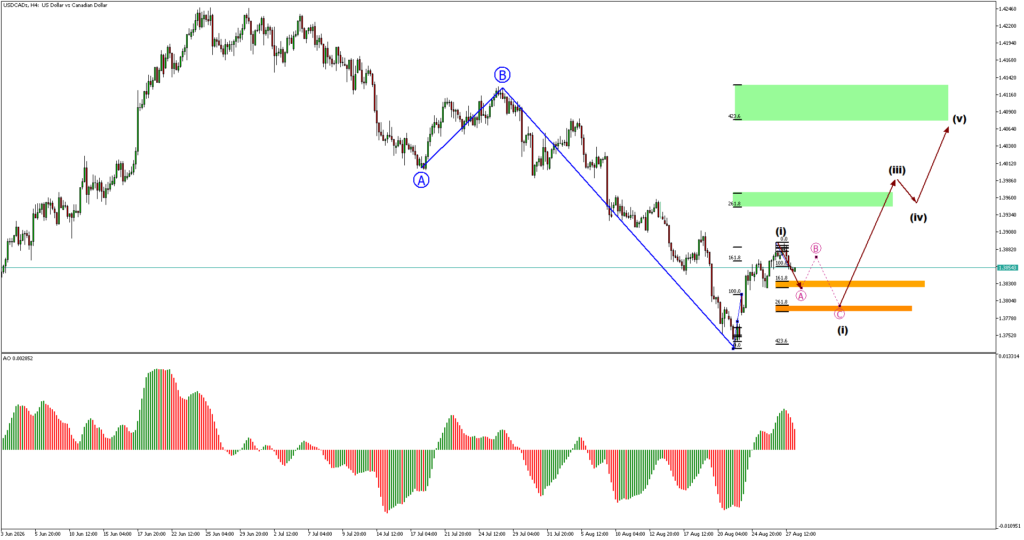
The broader structure begins with the formation of an A-B corrective pattern. Wave A developed during the initial recovery, followed by Wave B, which pushed price higher before the market resumed its larger downward movement.
Wave B was followed by a substantial decline, completing the larger corrective structure and creating the low from which the current recovery has emerged.
From this low, price has started to build a new bullish structure.
The major decline from the Wave B peak towards the recent low appears to have completed a five-wave bearish sequence on the smaller degree.
This is important because a completed five-wave decline can signal the end of a corrective phase and provide the foundation for a new impulsive move in the opposite direction.
The recent strong rebound from the low therefore gives additional support to the bullish scenario.
Following the major low, price initially moved higher and appears to have developed the first impulsive leg, labelled Wave (i).
However, the chart indicates that Wave (i) may not be the final upside movement.
Instead, the market is expected to undergo another corrective phase before beginning the much stronger Wave (iii).
The smaller Elliott Wave structure shown in magenta suggests an A-B-C correction:
The projected Wave C is directed toward the orange Fibonacci support zones.
Two important Fibonacci areas are highlighted on the chart.
The first orange zone is approximately around 1.3820–1.3840, while the deeper zone is around 1.3770–1.3800.
These zones are important because they could provide the support required for the completion of the corrective Wave C.
The preferred scenario is therefore:
Wave B → Wave C decline → Fibonacci support → bullish reversal.
Price does not necessarily need to touch the deepest zone. A bullish reaction from the first zone could already indicate that the correction has completed.
However, if price moves deeper, the second Fibonacci zone becomes the next area to monitor.
Once Wave C is completed, the chart projects a significant upside movement into Wave (iii).
This is potentially the most important leg of the current structure.
In Elliott Wave analysis, Wave III is typically associated with strong momentum as the market begins to recognize the underlying trend.
The first major upside target is located around the 1.3940–1.3980 region, corresponding to the projected Fibonacci extension zone.
A strong breakout through the recent resistance structure would provide additional confirmation that Wave (iii) is developing.
After Wave (iii) reaches its projected target, the chart anticipates another corrective pullback labelled Wave (iv).
This pullback should ideally remain relatively shallow compared with the preceding bullish movement.
The important principle is that Wave (iv) should not invalidate the overall bullish structure. If price successfully holds above the relevant structural support after Wave (iii), the market could then transition into the final Wave (v) advance.
The final projected upside target is located around 1.4080–1.4160.
This area corresponds with the larger Fibonacci extension zone shown in green.
Therefore, the complete bullish roadmap presented on the chart is:
Corrective Wave C → Wave (iii) → Wave (iv) pullback → Wave (v) → 1.4080–1.4160 area.
This gives the USDCAD structure a potentially attractive risk-to-reward profile if the correction completes inside the identified support zones.
The Awesome Oscillator (AO) is also showing signs of improving bullish momentum.
After spending a considerable period below the zero line during the previous bearish phase, the AO has started recovering and is currently showing stronger positive momentum.
This supports the possibility that the larger bearish move has lost momentum and that buyers are beginning to regain control.
However, AO should be used as confirmation rather than as the primary entry signal.
The most important confirmation remains the price reaction around the Fibonacci pullback zones.
Trading Scenario
The preferred scenario is:
1.3820–1.3840
→ Initial pullback/support zone
1.3770–1.3800
→ Deeper Fibonacci support zone
Bullish reversal
→ Completion of Wave C
1.3940–1.3980
→ Potential Wave (iii) target
Wave (iv) correction
→ Temporary pullback
1.4080–1.4160
→ Potential Wave (v) target
The bullish scenario becomes stronger if price produces a clear bullish reversal pattern from the orange zones followed by a break of the nearby resistance.
Conversely, a sustained breakdown below the deeper Fibonacci support would weaken or invalidate the current bullish wave count and require the structure to be reassessed.
USDCAD H4 is currently at a potentially important structural point. The chart suggests that the previous bearish sequence may have completed, while the current recovery could be the beginning of a new bullish impulsive structure.
The immediate focus is not to chase the current price, but to monitor the projected 1.3820–1.3840 and 1.3770–1.3800 Fibonacci zones for the completion of Wave C.
If support holds and a bullish reversal develops, the next major objective could be Wave (iii) toward 1.3940–1.3980, followed by a Wave (iv) correction and eventually Wave (v) toward the 1.4080–1.4160 region.
Key idea: Let the pullback complete first — then look for the next impulsive move higher.


The XAUUSD H4 chart is showing an interesting potential bullish reversal structure after a significant decline from the 4,650–4,690 region toward the 4,080–4,085 area....

If you are deciding between CFD and forex trading, understanding the differences between the two is an important first step.


Get the FXGT App


