Important Note!
We use cookies to ensure you get the best experience on our website.
By clicking ‘Agree,’ you accept our use of cookies as outlined in our cookies policy

EURUSD continues to develop a potentially bullish Elliott Wave structure on the Daily timeframe following the completion of a larger A-B-C corrective pattern.
The previous decline from the major high eventually formed a significant Wave C low around the 1.1300–1.1350 region. From this area, price began a strong recovery and subsequently developed a series of higher highs and higher lows, suggesting that a new impulsive structure may be forming.
The latest price action shows that EURUSD has already advanced strongly from the Wave C low and is now approaching an important resistance and Fibonacci projection area. While the broader structure remains bullish, the market may need to undergo a short-term Wave IV correction before continuing higher.
The preferred scenario therefore remains bullish, with the expected correction viewed as a temporary retracement rather than a reversal of the larger trend.
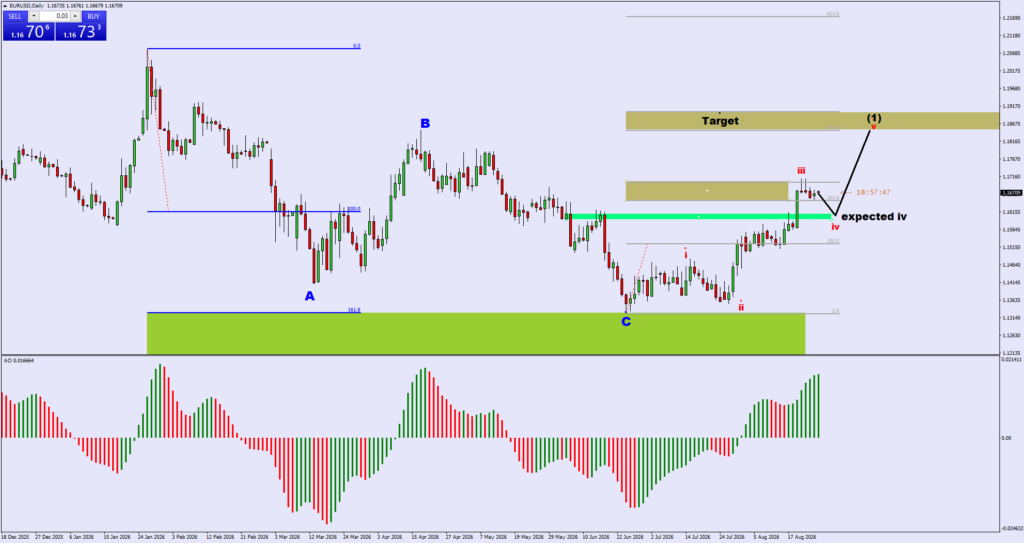
Completion of the Larger A-B-C Correction
The chart shows a clear corrective structure labelled A-B-C.
Wave A developed during the initial decline, followed by a recovery in Wave B. Price subsequently resumed its decline and completed Wave C near the lower green Fibonacci support zone.
The completion of Wave C is important because it provides the foundation for the current bullish structure.
Following the Wave C low, EURUSD began producing a series of impulsive movements to the upside. This transition from a corrective decline into a rising structure suggests that the market may have entered a new bullish phase.
The key level to monitor remains the Wave C low. As long as this low remains protected, the larger bullish interpretation remains valid.
After the Wave C low, the chart shows the development of the first and second subwaves, followed by a strong upside movement labelled subwave iii.
Subwave iii is normally expected to be one of the strongest portions of an impulsive sequence, and the recent price action is consistent with this characteristic.
EURUSD accelerated higher from the July low and subsequently broke through several intermediate resistance levels.
The strong upward movement has also pushed the Awesome Oscillator firmly into positive territory, providing additional evidence that bullish momentum has increased.
However, after such a strong advance, the market normally requires a period of consolidation or correction before another impulsive leg develops.
This is where the expected subwave iv becomes important.
The current structure suggests that subwave iii may have reached a temporary high around the 1.1670–1.1700 area.
The chart therefore projects a potential Wave IV pullback.
The highlighted green zone around 1.1580–1.1620 is the primary area to monitor during this correction.
This zone is particularly important because it can potentially act as a support area where buyers may re-enter the market.
If price retraces into this area and produces a bullish reaction, it would strengthen the Elliott Wave interpretation that the current decline is only Wave IV rather than the beginning of a larger bearish reversal.
The expected correction does not necessarily need to be deep. Wave IV can develop as a relatively shallow correction, especially when the underlying trend is strong.
Therefore, traders should focus more on price reaction around the support zone rather than attempting to predict the exact depth of the correction.
Fibonacci projections provide additional support for the current Elliott Wave scenario.
The chart highlights several Fibonacci levels, including the 100.0%, 161.8% and 261.8% projections.
The current price is trading above the 100% projection and has moved toward the higher Fibonacci extension levels.
The major projected target zone is located around 1.1850–1.1900, where the chart indicates the potential completion area for the larger Wave (1).
This area is important because it represents a significant Fibonacci projection zone and could become a potential profit-taking or consolidation area.
If EURUSD reaches this zone after completing Wave IV and Wave V, traders should expect the possibility of another corrective phase.
The Awesome Oscillator provides an additional perspective on the current momentum structure.
Following the Wave C low, AO moved from negative territory and gradually developed stronger positive momentum.
The latest histogram shows a significant expansion in bullish momentum, corresponding with the strong upside movement in EURUSD.
This supports the idea that the current larger structure remains bullish.
However, the indicator should also be monitored during the expected Wave IV correction.
A temporary reduction in AO momentum would not necessarily invalidate the bullish scenario. Instead, it could simply reflect the development of the corrective Wave IV.
The more important confirmation would be whether momentum subsequently begins to expand again as Wave V develops.
1.1580–1.1620 — Main Wave IV Support
This is the most important short-term zone on the chart.
A successful reaction from this area would support the bullish Wave IV–V scenario.
1.1670–1.1700 — Current Resistance Area
This region represents the recent high and the area where subwave iii may have completed.
A sustained break above this region after the correction would provide additional confirmation that Wave V is underway.
1.1850–1.1900 — Major Target Zone
This is the primary projected target area for the completion of Wave (1).
It is supported by the Fibonacci projection structure shown on the chart.
The preferred scenario can be summarised as follows:
Wave iii completion → Wave IV pullback → support around 1.1580–1.1620 → Wave V advance → target 1.1850–1.1900.
Under this scenario, the current weakness would be interpreted as a normal correction within a larger bullish structure.
A successful bullish reaction from the green support zone would be an important confirmation.
The next breakout above the recent high would then increase the probability of Wave V developing toward the projected target zone.
Although the bullish scenario remains preferred, traders should not ignore the possibility that the current Elliott Wave count could be invalidated.
If EURUSD breaks decisively below the important corrective structure and fails to hold the 1.1580–1.1620 support zone, the expected Wave IV structure would require reassessment.
A deeper correction would then become possible, particularly if price begins producing lower highs and lower lows on the Daily timeframe.
Therefore, the support zone should be treated as a key confirmation area rather than assuming that the bullish continuation is guaranteed.
EURUSD remains structurally bullish on the Daily timeframe following the completion of the larger A-B-C corrective pattern.
The current price action suggests that subwave iii may have completed, increasing the probability of a short-term Wave IV pullback.
The 1.1580–1.1620 zone is the key area to monitor during this correction. If buyers defend this region and price subsequently breaks above the recent high, the market could enter Wave V and continue toward the major 1.1850–1.1900 target zone.
The combination of the Elliott Wave structure, Fibonacci projections and positive AO momentum supports the bullish outlook.
Preferred outlook:
Wave IV pullback → support zone → Wave V continuation → 1.1850–1.1900 target.
Key invalidation:
A decisive breakdown through the important corrective structure would weaken the current bullish Elliott Wave count and require a reassessment of the projected Wave V scenario.


The XAUUSD H4 chart is showing an interesting potential bullish reversal structure after a significant decline from the 4,650–4,690 region toward the 4,080–4,085 area....

The AUDUSD weekly chart continues to show an interesting bullish Elliott Wave structure following the strong recovery from the previous major low.

Get the FXGT App


