Important Note!
We use cookies to ensure you get the best experience on our website.
By clicking ‘Agree,’ you accept our use of cookies as outlined in our cookies policy

US Oil remains under strong bearish pressure after breaking below several key support levels. The recent decline has formed a clear impulsive structure, suggesting that sellers continue to dominate the market. However, Elliott Wave analysis indicates that the current sell-off may temporarily pause as the market prepares for a corrective rally before extending its broader downtrend.
The current outlook combines Elliott Wave, Fibonacci extensions, price structure, and Awesome Oscillator (AO) momentum analysis.
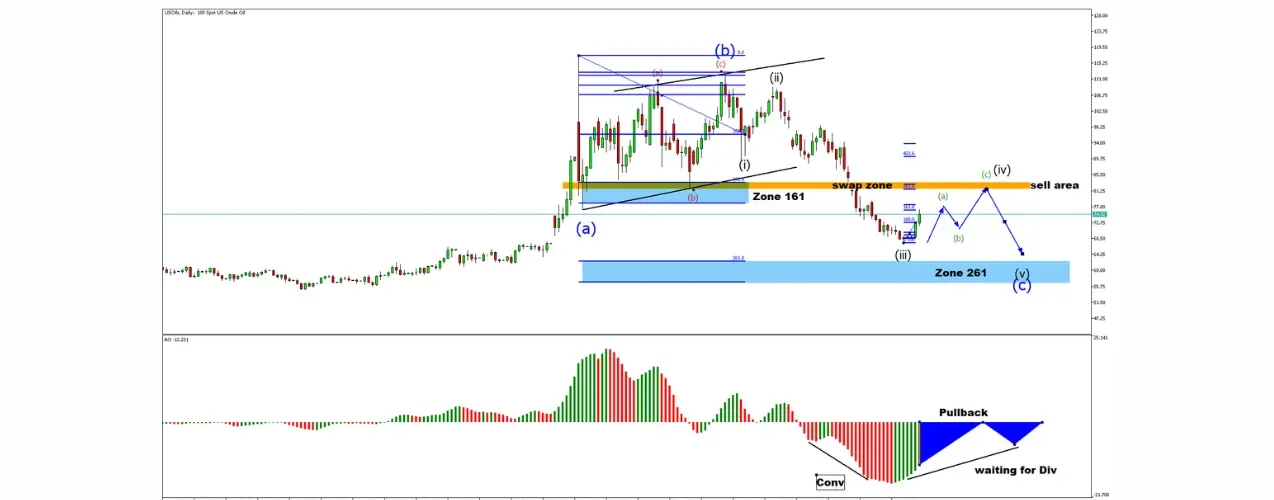
The daily chart suggests that US Oil is currently completing Wave (iii) of a larger bearish impulse.
After Wave (iii) finishes, price is expected to enter a corrective Wave (iv) consisting of an ABC structure.
The anticipated sequence is:
This recovery is viewed as a counter-trend correction rather than the beginning of a new bullish trend.
The highlighted orange resistance zone represents a significant technical barrier.
This area combines:
If bearish reversal patterns appear after price reaches this resistance zone, traders may look for opportunities to rejoin the dominant bearish trend.
Following the completion of Wave (iv), Elliott Wave theory suggests that Wave (v) should begin.
The projected downside target lies within the blue support zone, which aligns closely with the Fibonacci 261.8% extension.
This area represents the next major objective if selling momentum resumes.
The Awesome Oscillator previously showed bearish convergence during the recent decline.
Momentum is now beginning to recover, supporting the expectation of a short-term corrective bounce.
However, traders should closely monitor the AO for a new bearish divergence as price approaches the resistance zone. Such a signal would strengthen the probability that Wave (iv) has completed and that Wave (v) is ready to begin.
In the short term, US Oil may continue forming a corrective ABC rally toward the highlighted swap zone.
If the market rejects this resistance and bearish momentum returns, the broader downtrend is expected to resume, targeting the Fibonacci 261.8% extension support zone.
Unless price breaks decisively above the highlighted resistance area, the overall technical structure continues to favour bearish continuation, with the corrective rally offering potential selling opportunities before the next impulsive decline.


Global financial markets experienced a volatile week as investors reacted to major economic reports, corporate earnings, and ongoing economic uncertainty.


The week of October 19–23, 2026, brings several high-impact economic events that could influence global financial markets.

Get the FXGT App


