Important Note!
We use cookies to ensure you get the best experience on our website.
By clicking ‘Agree,’ you accept our use of cookies as outlined in our cookies policy

Gold (XAUUSD) is showing signs of a significant corrective phase on the H4 timeframe after completing a strong bullish advance. The latest price action suggests that the market may have entered a deeper correction, with the current structure potentially developing into a larger Elliott Wave decline.
The chart indicates that the previous bullish sequence has reached an important resistance area, followed by a sharp reversal. Price has now broken below the near-term support zone, while the Awesome Oscillator (AO) has simultaneously shifted strongly into negative territory.
The current Elliott Wave projection suggests a possible sequence of Wave II → Wave III → Wave IV → Wave V, with Wave IV potentially producing a temporary recovery before the market resumes its decline toward the projected Wave V target zone.
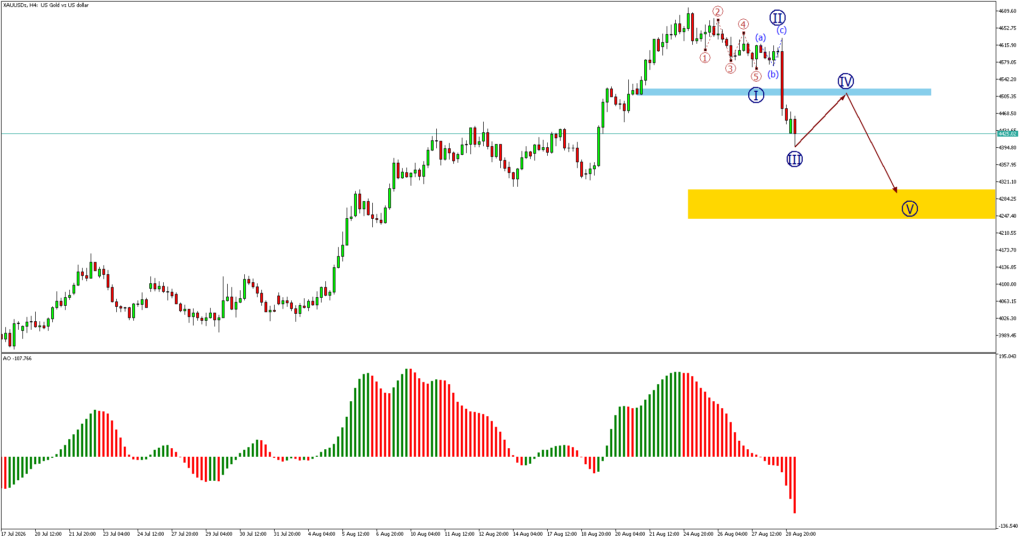
XAUUSD previously developed a strong bullish structure, advancing from the lower levels around the 4,000 region toward the 4,600–4,690 area.
The strength of this advance indicates that buyers were firmly in control during the previous phase.
However, the market eventually reached a significant high near 4,690, where price began to lose momentum.
The Elliott Wave count on the chart identifies this region as an important completion area for the previous impulsive structure.
The subsequent price action is now suggesting that the market may have entered a corrective phase.
At the recent high, the chart shows a smaller-degree Elliott Wave sequence labelled:
① → ② → ③ → ④ → ⑤
This is important because the completion of a five-wave structure can signal that the preceding directional move has reached maturity.
Following Wave ⑤, price failed to continue higher and instead started moving sharply lower.
The failure to sustain the highs provides an early warning that the bullish impulse may have completed, at least temporarily.
The chart also shows a larger-degree structure labelled I, II, III, IV and V.
The recent high is associated with Wave II, while the sharp decline that followed is labelled Wave III.
This suggests that the market may now be transitioning into a larger bearish phase.
One important characteristic of the current movement is the speed of the decline.
Price dropped rapidly from the upper resistance region and broke through the blue support zone around 4,400–4,420.
This type of impulsive movement is consistent with the possibility that Wave III is developing with strong downside momentum.
The blue horizontal zone around 4,400–4,420 is an important structural level on the chart.
Previously, this area acted as support during the bullish structure.
Once price broke below this zone, the previous support structure was effectively weakened.
The sharp bearish candles following the breakdown indicate that sellers have gained significant short-term control.
This level could now become an important resistance area if price eventually retraces higher. Therefore, traders should monitor whether any recovery toward this region is rejected.
Although the immediate momentum is bearish, the chart does not suggest that price must continue falling in a straight line.
Instead, the projected Elliott Wave structure shows a possible Wave IV rebound.
The expected path is:
Wave III decline → Wave IV recovery → Wave V decline
The projected Wave IV target is around the 4,405–4,430 region, close to the previous blue support area.
This is technically significant because former support can become resistance after a confirmed breakdown.
Therefore, the potential Wave IV recovery could provide a retest of the broken support before the next bearish leg begins.
After Wave IV completes, the chart projects another major decline into the yellow support zone.
The projected Wave V target area is approximately:
4,250–4,300
This is the most important downside target shown on the chart.
The yellow zone represents a potential area where the larger bearish sequence could eventually find support and where the Wave V structure could potentially complete.
However, the market does not have to reach this zone immediately.
Wave IV may first develop before the final bearish leg toward the projected Wave V target.
The Awesome Oscillator provides an important confirmation of the current price structure.
During the previous bullish advance, AO remained strongly positive, reflecting strong upside momentum.
However, momentum began to deteriorate as price approached the recent high.
Following the reversal, AO has fallen sharply below the zero line.
The latest histogram bars are expanding significantly on the negative side, indicating that bearish momentum has accelerated.
This is an important confirmation because the price decline is occurring together with a substantial deterioration in momentum.
At present, there is therefore no clear indication from AO that the bearish move has completely exhausted itself.
If XAUUSD begins to recover from the current level, the first area to watch is the previous blue support zone around 4,400–4,420.
A recovery into this area would represent a potential retest of broken support.
There are two possible outcomes:
Bearish scenario:
Price rebounds toward the 4,400–4,420 region, encounters resistance, and then resumes the decline toward Wave V.
Bullish scenario:
Price reclaims the blue zone decisively and establishes sustained trading above it, weakening the immediate bearish Elliott Wave scenario.
Therefore, the reaction around this area will be extremely important in determining whether the projected Wave IV is merely a corrective rebound or the beginning of a larger bullish reversal.
Based on the current chart structure, the preferred roadmap is:
Recent high near 4,690
→ Completion of the preceding bullish structure
↓
Wave III
→ Strong bearish decline already underway
↓
Wave IV
→ Expected temporary recovery toward the 4,400–4,420 region
↓
Wave V
→ Potential continuation lower
↓
Target zone: 4,250–4,300
This structure should be treated as a working Elliott Wave scenario rather than an absolute prediction, because wave counts can change as new price data develops.
The preferred strategy is to avoid chasing the current bearish move after the sharp decline.
Instead, traders can monitor whether price produces a corrective rebound toward the 4,400–4,420 resistance area.
If the market forms bearish rejection around this area, it could provide confirmation for the continuation of the projected Wave V.
The key levels are:
4,400–4,420
→ Potential Wave IV / retest resistance
4,250–4,300
→ Potential Wave V target/support zone A sustained break back above the 4,400–4,420 region would weaken the immediate bearish scenario and require the Elliott Wave count to be reassessed.
XAUUSD H4 is currently showing a clear deterioration in short-term momentum following the failure to sustain the recent high near 4,690.
The combination of the Elliott Wave structure, breakdown below the previous support zone and strongly negative AO suggests that the market may be developing a larger corrective decline.
The preferred scenario is for price to potentially form a Wave IV recovery toward the 4,400–4,420 region, followed by another bearish movement into Wave V, with the projected target located around 4,250–4,300.
The key level to watch is therefore 4,400–4,420. If this former support becomes resistance, it would strengthen the bearish continuation scenario.
Key idea: The current decline may not be the end of the correction — a Wave IV rebound could come first, followed by another potential leg lower toward Wave V support.


The XAUUSD H4 chart is showing an interesting potential bullish reversal structure after a significant decline from the 4,650–4,690 region toward the 4,080–4,085 area....

The AUDUSD weekly chart continues to show an interesting bullish Elliott Wave structure following the strong recovery from the previous major low.

Get the FXGT App


