Important Note!
We use cookies to ensure you get the best experience on our website.
By clicking ‘Agree,’ you accept our use of cookies as outlined in our cookies policy

EUR/USD continues to trade within a well-defined bearish structure on the daily chart after failing to break above the primary descending trendline. Price is currently developing Wave (iii) and is expected to stage a short-term Wave (iv) pullback before the downtrend resumes.
As long as the pair remains below the descending trendline, the overall bearish outlook remains intact.
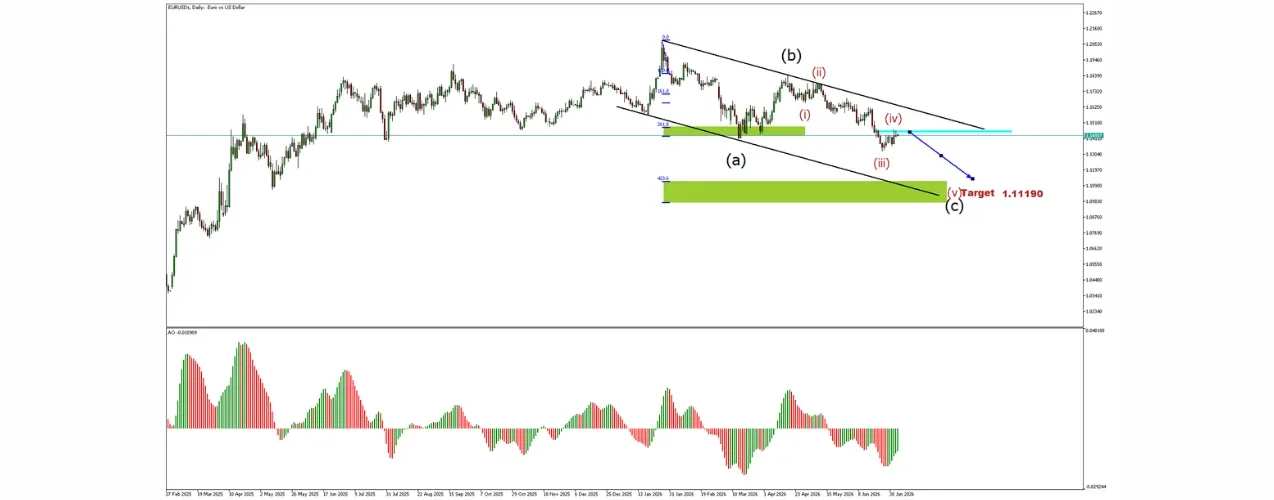
The highlighted blue resistance area represents a potential sell zone, where sellers could regain control of the market.
If price retraces into this area and fails to break above the descending trendline, it would strengthen the probability of Wave (v) beginning, in line with the Elliott Wave structure.
Following the expected Wave (iv) correction, EUR/USD is projected to continue lower toward 1.11190, which aligns closely with the 423.6% Fibonacci Extension.
This zone also represents a significant support area where bearish momentum may begin to slow and profit-taking could emerge.
The Awesome Oscillator (AO) remains below the zero line, indicating that bearish momentum is still dominant despite the possibility of a short-term rebound.
Traders should monitor:
EUR/USD maintains a bearish market structure while trading below the descending trendline. A limited pullback into the resistance zone may offer a selling opportunity before the pair resumes its decline toward the 1.11190 target, supported by both Elliott Wave analysis and Fibonacci Extension projections.


The XAUUSD H4 chart is showing an interesting potential bullish reversal structure after a significant decline from the 4,650–4,690 region toward the 4,080–4,085 area....

If you are deciding between CFD and forex trading, understanding the differences between the two is an important first step.


Get the FXGT App


