Important Note!
We use cookies to ensure you get the best experience on our website.
By clicking ‘Agree,’ you accept our use of cookies as outlined in our cookies policy
Gold (XAU/USD) has staged a strong recovery from its recent low and is now testing a significant resistance area around the 161.8% Fibonacci Extension.
The highlighted green zone represents a critical decision point. As long as price remains below this resistance, the broader market structure continues to favor the bearish scenario.
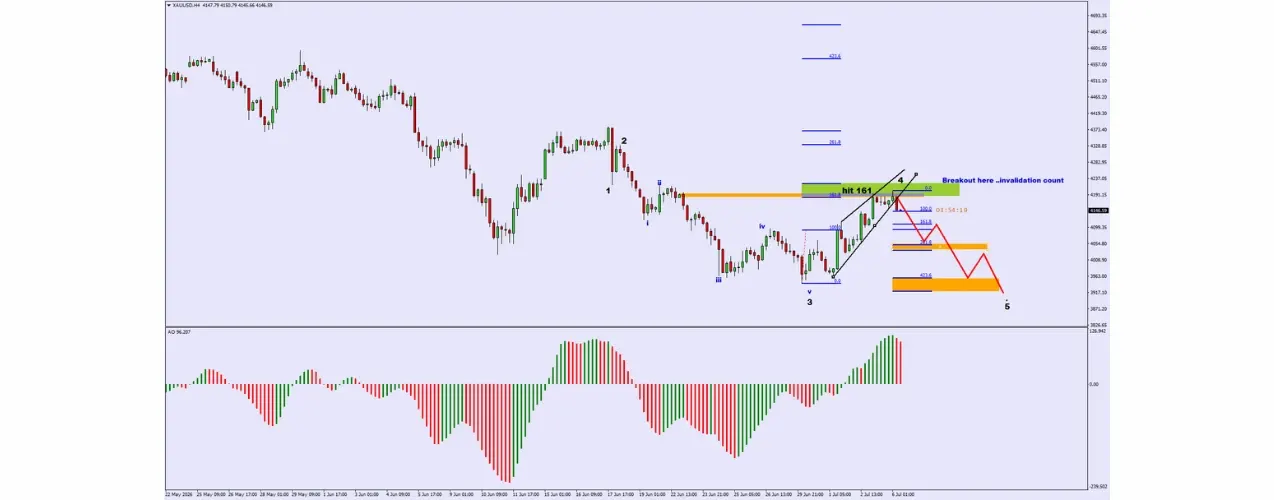
According to the current Elliott Wave count, Gold is likely completing Wave 4, which is typically a corrective phase before the final Wave 5 decline.
The current rebound may end within the resistance zone, allowing sellers to regain control and continue the prevailing downtrend.
However, a decisive breakout above the green resistance zone would invalidate the current Elliott Wave count, requiring a reassessment of the overall market structure.
If the resistance zone successfully caps the rally, XAU/USD is expected to resume its decline toward the next Fibonacci Extension support levels.
The primary downside objective is located near the 423.6% Fibonacci Extension, where Wave 5 is projected to complete.
The Awesome Oscillator (AO) remains in positive territory, but bullish momentum is beginning to fade.
A contraction in the AO histogram followed by a move below the zero line near the resistance zone would provide additional confirmation that bearish momentum is returning.
XAU/USD is approaching a crucial technical resistance area. A rejection from the 161.8% Fibonacci Extension would strengthen the bearish outlook and support a continuation toward the projected Wave 5 target.
Conversely, a sustained breakout above the resistance zone would invalidate the current Elliott Wave structure and suggest that a new market scenario is developing.


The XAUUSD H4 chart is showing an interesting potential bullish reversal structure after a significant decline from the 4,650–4,690 region toward the 4,080–4,085 area....

If you are deciding between CFD and forex trading, understanding the differences between the two is an important first step.


Get the FXGT App


