Important Note!
We use cookies to ensure you get the best experience on our website.
By clicking ‘Agree,’ you accept our use of cookies as outlined in our cookies policy

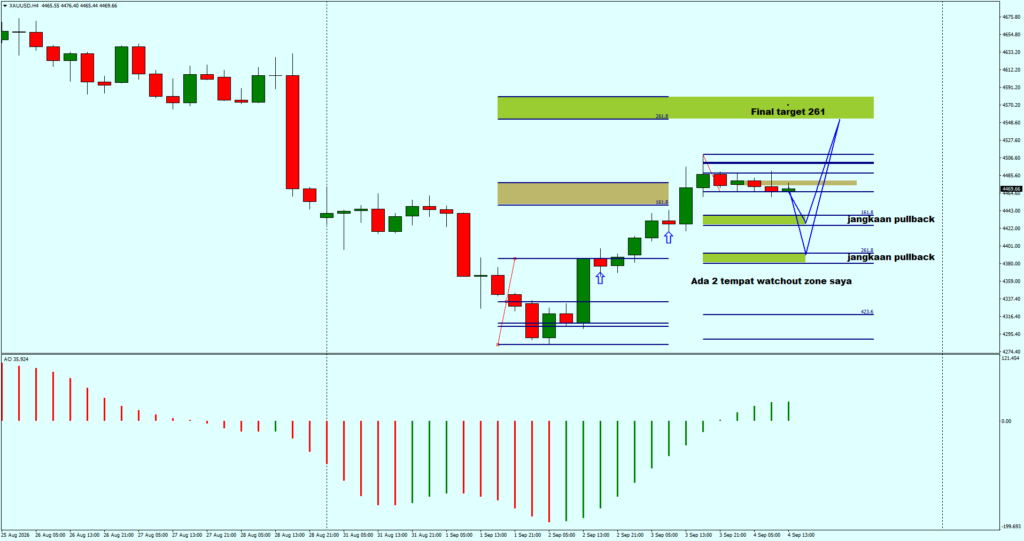
Gold (XAUUSD) is currently showing signs of a potential recovery after experiencing a sharp corrective decline from the recent high area. On the H4 timeframe, price has moved lower aggressively before finding support around the 4,270–4,300 region and beginning to stabilize.
The current structure suggests that the decline may have completed an important corrective phase, while the recent recovery indicates that buyers are beginning to regain control.
However, price is now approaching an important resistance and retracement area. Therefore, rather than chasing the current upward movement, the more attractive setup may come from a pullback into the identified Fibonacci support zones before another potential bullish expansion.
The chart highlights two potential pullback zones that could become important areas for monitoring before the next bullish move toward the projected 261.8% Fibonacci target.
The broader H4 structure remains constructive despite the recent sharp correction. Prior to the decline, XAUUSD established a strong bullish sequence, producing a series of higher highs and higher lows.
The most recent decline from the 4,670–4,680 region represents a significant corrective movement. Price initially fell sharply and subsequently formed a lower consolidation structure around the 4,430–4,470 area.
From the Elliott Wave perspective, the chart suggests that the previous impulsive structure may have completed its Wave 3 and Wave 4 sequence, followed by the development of Wave 5. The subsequent decline can therefore be interpreted as part of a larger corrective structure rather than necessarily the beginning of a new long-term bearish trend.
The Fibonacci projections on the chart provide several important reference levels.
The first potential pullback zone is located around the 4,420–4,440 area. This region corresponds to an important Fibonacci retracement area and could act as the first support if price experiences a short-term correction.
The second and deeper pullback zone is located around 4,380–4,400. This area is particularly important because it represents the deeper Fibonacci support and could provide a stronger reaction if sellers manage to push price below the first zone.
Therefore, the two zones can be viewed as potential watch-out areas for bullish confirmation rather than automatic buy levels.
If price enters either zone and produces a clear bullish reaction, the probability of a continuation toward the upside target would increase.
At the latest price action, XAUUSD has recovered from the recent low and is trading around the 4,460–4,470 area.
The recovery is important because price has managed to move away from the lower support region instead of continuing to break down.
However, the current structure also shows that price is approaching a resistance cluster. This means the market could experience another retracement before the next impulsive move.
The preferred scenario is therefore:
Recovery → Pullback → Support reaction → Bullish continuation.
The chart’s projected blue path also illustrates this possibility, with price potentially retracing into one of the identified support zones before accelerating higher.
Fibonacci 261.8% Target
The major upside objective is located around the 261.8% Fibonacci extension zone, highlighted by the upper green target area.
This is the key long-term target projected from the current Elliott Wave and Fibonacci structure.
If the corrective phase has indeed completed and the next impulsive wave develops as expected, price could eventually move toward this 261.8% extension area.
The target zone is approximately around 4,550–4,570, making it the main upside objective in the current technical scenario.
Importantly, price does not necessarily need to move directly toward this target. A healthy bullish structure could involve several smaller pullbacks and consolidations before reaching the projected objective.
The Awesome Oscillator (AO) at the bottom of the chart also provides an additional element to monitor.
During the previous decline, the AO moved deeply into negative territory, reflecting strong bearish momentum. However, the histogram has subsequently started to recover from its extreme negative reading.
This suggests that bearish momentum may be losing strength.
For the bullish scenario to become stronger, traders should monitor whether the AO continues to recover and eventually moves toward the zero line or into positive territory.
A strengthening AO together with a bullish reaction from either Fibonacci pullback zone would provide additional confirmation that buyers are regaining momentum.
Based on the current structure, there are two main areas that deserve attention:
First watch zone: approximately 4,420–4,440
Second watch zone: approximately 4,380–4,400
These areas should not automatically be treated as immediate buy entries. Instead, traders should wait for price-action confirmation such as a bullish rejection, bullish engulfing pattern, strong impulsive candle or evidence that the corrective structure has completed.
If buyers successfully defend these areas, the next upside objective would be the previous resistance region followed by the 261.8% Fibonacci target around 4,550–4,570.
On the other hand, a decisive breakdown through both support zones would weaken the bullish setup and indicate that the correction could be deeper than currently anticipated.
The XAUUSD H4 chart currently presents a potential bullish recovery scenario following a significant corrective decline.
The key idea is not to chase price at the current level, but to monitor the two identified Fibonacci pullback zones around 4,420–4,440 and 4,380–4,400.
A strong bullish reaction from either zone could provide the confirmation needed for another impulsive move higher. If the Elliott Wave structure develops as projected, the major objective remains the 261.8% Fibonacci extension around 4,550–4,570.
In short:
Watch the pullback → wait for bullish confirmation → target the 261.8% Fibonacci extension.
The bullish scenario remains valid as long as the key support structure holds, but traders should remain prepared for deeper retracement if those zones fail.


The XAUUSD H4 chart is showing an interesting potential bullish reversal structure after a significant decline from the 4,650–4,690 region toward the 4,080–4,085 area....

The AUDUSD weekly chart continues to show an interesting bullish Elliott Wave structure following the strong recovery from the previous major low.

Get the FXGT App


