Important Note!
We use cookies to ensure you get the best experience on our website.
By clicking ‘Agree,’ you accept our use of cookies as outlined in our cookies policy

Gold (XAUUSD) on the H4 timeframe is showing signs of a significant corrective phase following the strong bullish advance seen throughout August. The latest price action suggests that the previous impulsive structure may have completed its major Wave 5, opening the possibility for a deeper corrective movement.
The chart shows a clear Elliott Wave structure, with the previous bullish movement developing through Waves 1, 2, 3, 4 and 5. After Wave 5 reached its peak near the 4,670–4,680 region, price experienced a sharp reversal and broke below the previous short-term structure.
This decline is important because it indicates that the market may have entered a larger corrective sequence rather than simply experiencing a normal intraday pullback.
The current technical structure therefore favours a bearish correction, with the potential for a corrective ABC pattern to develop.
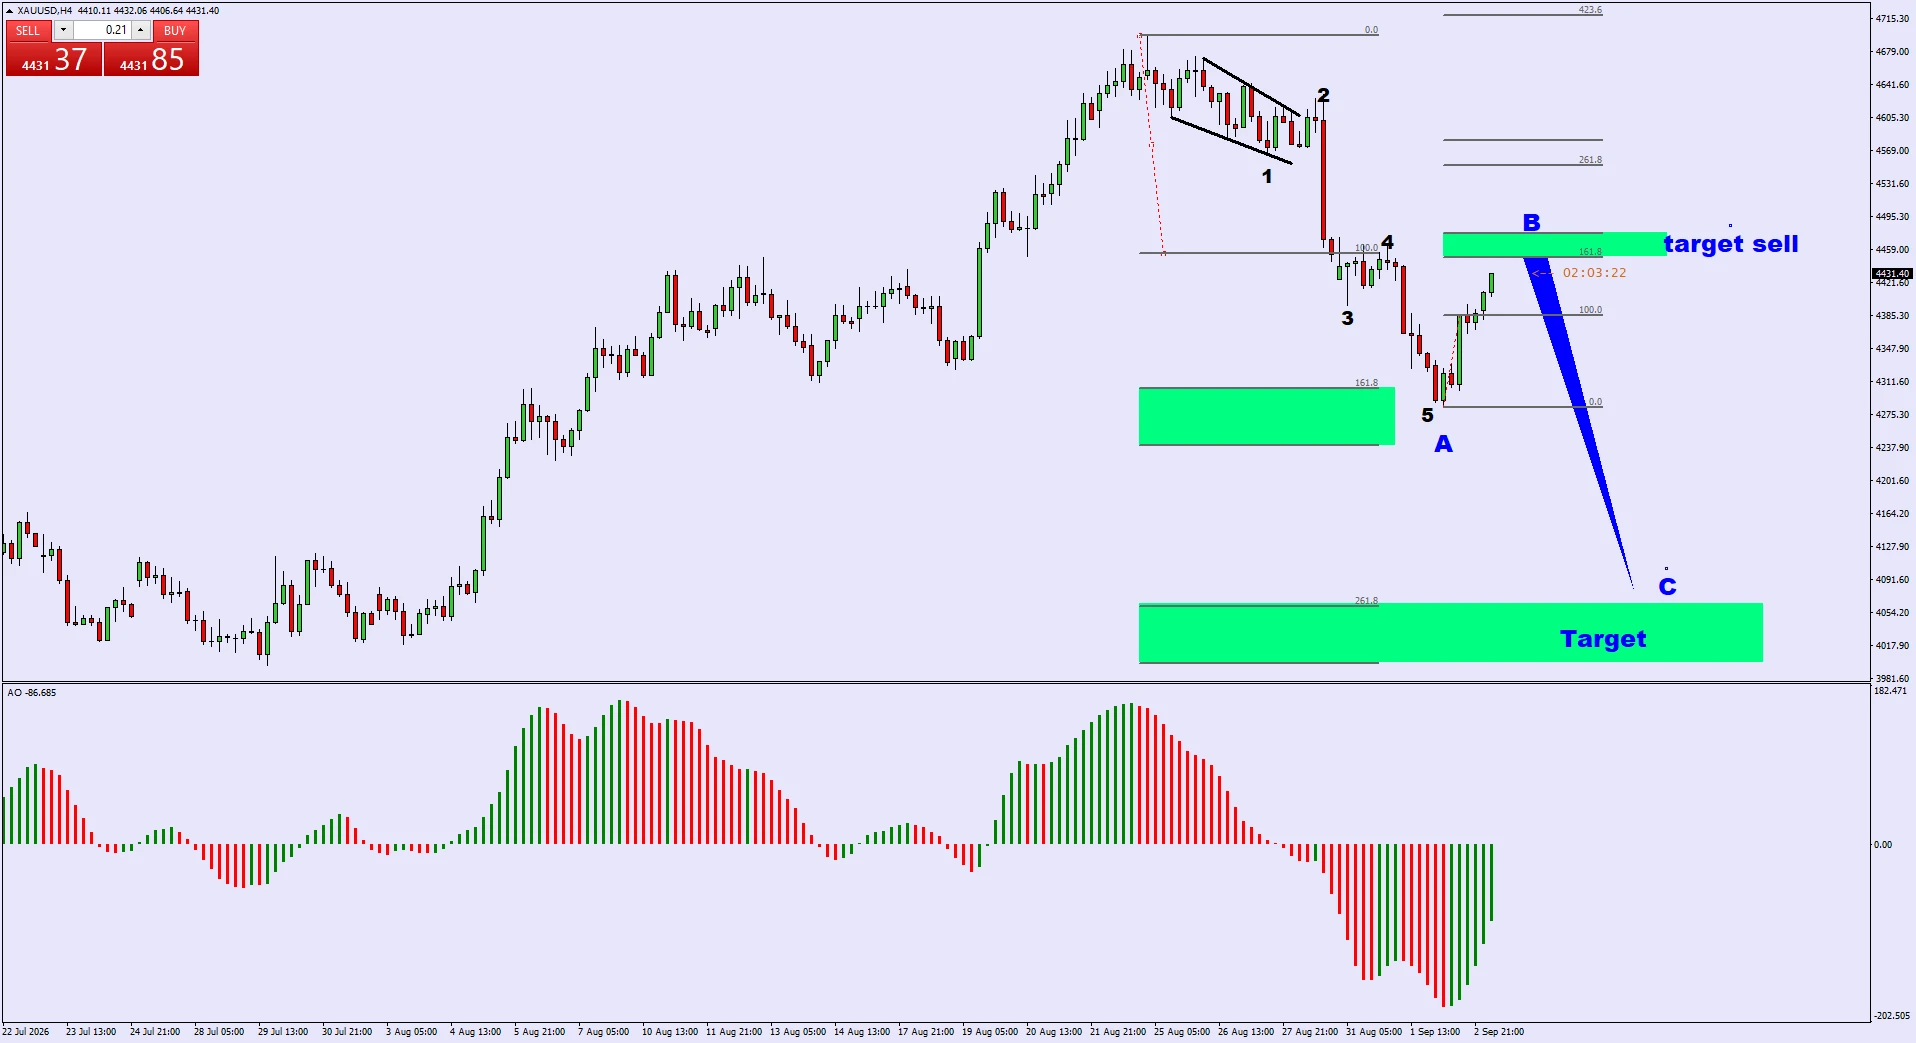
Major Elliott Wave Structure
The broader H4 structure indicates that Gold had been progressing through a five-wave bullish sequence.
Wave 1 initiated the upward movement, followed by a corrective Wave 2. This was followed by a strong Wave 3 advance, while Wave 4 developed as a relatively contained correction before the final Wave 5 pushed price toward the recent high.
The completion of Wave 5 is significant because, under the Elliott Wave framework, a completed five-wave impulsive sequence is commonly followed by a corrective phase.
The sharp decline from the recent high provides the first indication that the market may now be transitioning from the bullish impulse into a larger correction.
Wave 1 and Wave 2 of the New Bearish Structure
Following the completion of the previous Wave 5, the chart shows an initial bearish decline labelled as Wave 1.
Price subsequently attempted to recover, creating a corrective Wave 2 structure. This recovery is currently approaching an important Fibonacci resistance area.
The projected structure suggests that the current recovery may represent a corrective Wave B, rather than the beginning of a new bullish impulse.
This distinction is crucial.
If the recovery fails around the highlighted resistance zone, it would strengthen the bearish Elliott Wave interpretation and potentially trigger another impulsive decline.
The upper green zone around 4,450–4,460 represents the primary area to monitor for a potential selling opportunity.
This zone aligns with the Fibonacci retracement structure shown on the chart and may provide resistance during the expected corrective rebound.
The preferred scenario is therefore:
Price rebounds → reaches the target sell zone → forms bearish rejection → resumes the downside movement.
Traders should avoid assuming that every move upward represents a bullish reversal. Within an Elliott Wave correction, a strong rebound can simply be part of a Wave B structure before Wave C begins.
Wave C Downside Projection
The most important part of the current setup is the projected Wave C decline.
Once the corrective Wave B is completed, the chart suggests that Gold could resume its downward movement and develop a more aggressive Wave C.
The projected Wave C target is located around the 4,050–4,100 region, where the chart identifies the 261.8 Fibonacci extension zone.
This makes the lower green zone an important potential destination for the correction.
A move toward this area would represent a substantial retracement from the recent high and would be consistent with a larger H4 corrective structure.
The Fibonacci levels provide additional confirmation for the projected downside scenario.
The 161.8 Fibonacci level is positioned around the intermediate target area, while the 261.8 Fibonacci extension provides a deeper potential target.
The 261.8 extension is particularly important because it coincides with the projected Wave C destination.
Therefore, the combination of:
creates a technically interesting downside setup.
The Awesome Oscillator at the bottom of the chart also supports the possibility of further weakness.
After reaching strongly positive territory during the previous bullish move, the indicator subsequently turned sharply negative following the recent sell-off.
Although the histogram is beginning to recover from its extreme negative reading, it remains below the zero line.
This suggests that the current upward movement in price could still be a corrective rebound rather than confirmation of a new bullish trend.
A renewed expansion of negative AO bars during the next bearish rejection would strengthen the downside scenario.
Key Levels to Watch
Resistance / Target Sell Zone
4,450–4,460
This is the main area to monitor for a potential bearish rejection. A failure to break and sustain above this zone would favour the projected Wave C scenario.
Intermediate Support
Around 4,270–4,300
This area may provide temporary support during the decline. However, if price breaks below it decisively, the probability of continuation toward the deeper Fibonacci target increases.
Major Downside Target
Around 4,050–4,100
This is the key projected Wave C target, corresponding closely with the 261.8 Fibonacci extension zone shown on the chart.
Alternative Scenario
The bearish setup would become less convincing if Gold breaks strongly above the 4,450–4,460 resistance zone and establishes sustained price acceptance above it.
Such a move would suggest that the corrective Wave B may be extending further than expected, or that the current Elliott Wave count requires adjustment.
Therefore, the resistance zone should be treated as a decision area, rather than assuming that price must reverse from it.
The technical structure remains bearish as long as the corrective rebound fails to invalidate the current wave count.
The XAUUSD H4 chart currently presents a potential bearish corrective setup following the completion of the previous five-wave bullish structure.
The preferred Elliott Wave interpretation is that Gold has completed Wave 5 and is now developing a larger corrective pattern. The current rebound could represent Wave B, with the potential for a subsequent Wave C decline.
The key area to watch is the 4,450–4,460 target sell zone. If price reaches this area and produces a clear bearish rejection, the next downside movement could target the 4,270–4,300 region, followed potentially by the deeper 4,050–4,100 Fibonacci 261.8 zone.
In short:
Wave 5 completed → corrective rebound → watch 4,450–4,460 for rejection → potential Wave C decline → major target around 4,050–4,100.


The XAUUSD H4 chart is showing an interesting potential bullish reversal structure after a significant decline from the 4,650–4,690 region toward the 4,080–4,085 area....

The AUDUSD weekly chart continues to show an interesting bullish Elliott Wave structure following the strong recovery from the previous major low.

Get the FXGT App


